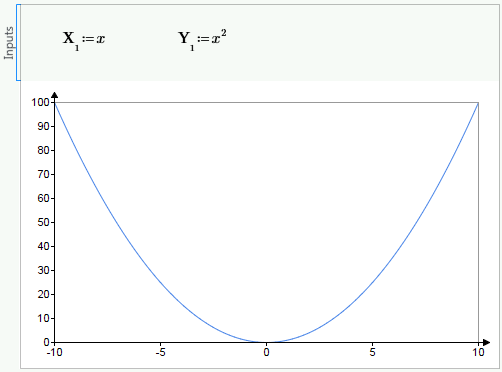
1. Insert a Chart component and then define and plot this trace:
2. Use the right hand side handle to resize the chart in the x direction.
The x-axis tick mark increment is adjusted accordingly while preserving the minimum and maximum values of the x-axis range.
The y-axis is not affected.
3. Click Undo to return the chart to its original size.
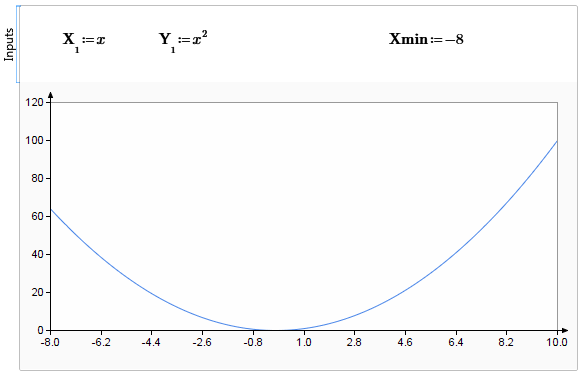
4. Type Xmin:=-8. The minimum x tick mark and increment are adjusted accordingly. The maximum x tick mark is not affected:
5. Use the right hand side handle to resize the chart in the x direction. This time, the x-axis tick mark increment as well as the minimum and maximum tick marks remain unchanged, regardless of how wide you make the chart.
Alternatively, you can define Xmin in the Chart application, using the axis, Setup, User-Defined Range, Minimum field.
Resizing the Chart in Other Directions
You can use the bottom side handle to resize the chart in the y direction, and use Ymin or Ymax to set the minimum or maximum y-axis tick marks, respectively.
Similarly, you can use the bottom right corner handle to freely resize the chart in both the x and y directions, and use Xmin, Ymin, Xmax, Ymax, Y2min, Y2max to set the minimum or maximum axes tick marks.
The effect on the chart in both cases is similar to when resizing the chart in the x direction.

 axis, Setup, User-Defined Range, Minimum field.