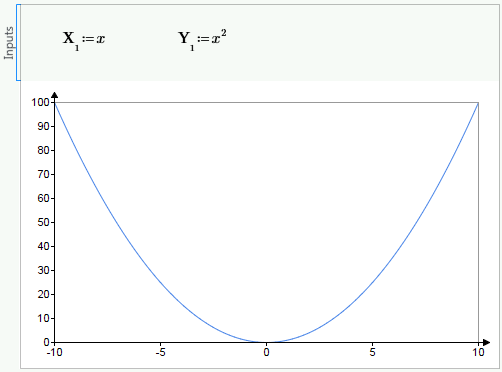
2. Insert X1 and Y1 and set their values to x and x2, respectively. The trace appears in the plot area.
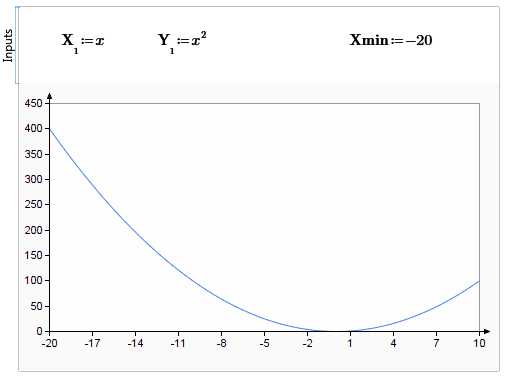
3. Manually type and define Xmin in the Inputs area to set the lower value of the X-axis tick mark.
Additional Information
• The definition of Xmin affects the range of the plotted points. In this case, the x-axis range is extended from –10 to 10 to –20 to 10.
• You can also set the lower x-axis limit on the sidebar of the Chart application.
Go to the X-axis Setup tab, and under User-Defined Range, edit the Minimum field. Note, this method of changing the x-axis range does not affect the range of the plotted points, as would happen with Xmin and Xmax in Mathcad.
For example, if you set Minimum to -30, the axis range extends to -30 but no additional points appear between -30 to -20.
• You can set the other axes limits by manually defining Xmax, Ymin, Ymax, Y2min, or Y2max, or by editing the Minimum or Maximum for the relevant axis in the PTC Mathcad Chart application.
• To avoid confusion, consider defining your axes limits either in your worksheet or in PTC Mathcad Chart application, but not both.