1. Insert a Chart component and click anywhere in the Inputs area.
2. Right-click and select Insert X-Axis Expression to define each of the traces.
The trace number in the index increases automatically.
3. Right-click and select Insert Y-Axis Expression to define each of the traces.
4. Click outside the chart component. The traces appear in the plot area.
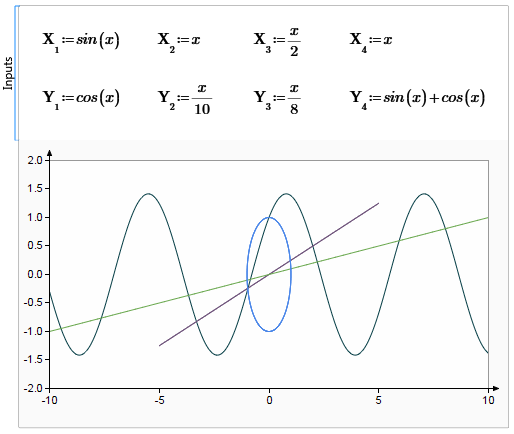
For example, this plot shows the definitions of four traces in the Inputs area and the four corresponding traces in the plot area:
5. If the value of X is common to all four traces, then you can replace the four definitions of X with a single definition without an index, as shown below:
Similarly, you can have a single Y definition without an index if it applies to more than one trace.