1. In a worksheet, click where you want to insert a chart component.
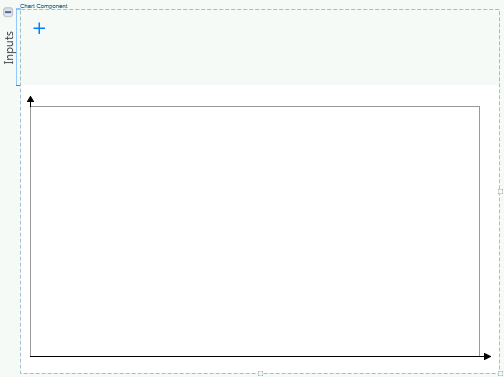
2. On the Math tab, in the Regions group, click Chart Component and select Insert Chart Component. An empty Chart Component block appears.
You can hide the Inputs area by clicking the icon. To show the Inputs area, click the icon.
3. Click anywhere in the Inputs area.
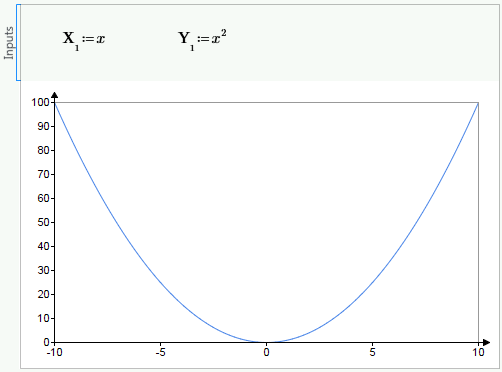
4. Right-click and select Insert X-Axis Expression from the menu. A math region is inserted for defining the X1 axis. Set the value of X1 to x.
5. Right-click outside the region containing the X1 definition and select Insert Y-Axis Expression. A new math region is inserted for defining the Y1 axis. Set the value of Y1 to x2.
6. Press Enter. The plot appears as a single trace.
• The index of 1 in the X1 expression is the trace number.
• The default range for the plotted points is -10<x<10. If you want to use another range, then you can define it above the Chart component (for example, x:=0..100). You can also plot points defined in vectors.