You can customize every color within your chart by specifying default colors, recent colors, or custom colors.
You can independently customize the colors of these items within your chart:
• Chart area background and border
• Plot area background and border
• Chart legend text, background, and border
• Chart title text, background, and border
To customize any chart color, click the Chart icon , Styles tab, and then click Chart Background, Chart Border, Plot Area, or Plot Border.
The following two sections are examples of customizing line and area colors.
Chart Border Color
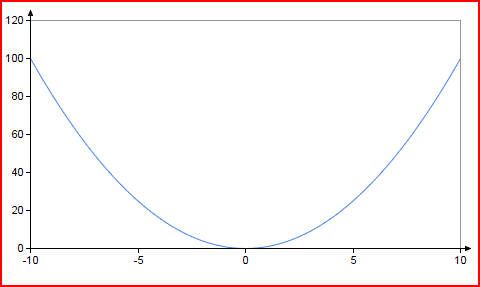
This example shows how to customize the color of a chart border line.
1. Select the Chart Border checkbox, and then click Color to open the Default Color Set.
In a new Mathcad Prime session, the Recent Color list is empty.
2. Click the red color. Under Thickness, select other than the default thickness.
The color red is added to the Recent Color list.
3. To choose a specific RGB color for your border, click Color to open the Default Color Set, and then click More Colors to open the RGB dialog box.
The three Settings fields display the current RGB values, and the Preview field and the slider show the corresponding color. The slider enables you to choose a specific shade of the selected color that spans the spectrum from black to white through the selected color.
a. Choose one of the following methods to specify an RGB color:
▪ Click one of the Basic colors. These colors have predefined RGB values.
▪ Type a number between 0–255 in each of the three Settings fields.
▪ Click inside the color circle. A cross hair appears over the selected color. Move the slider to select the desired shade.
b. Click OK to close the RGB dialog box. The selected color is added to the Recent Color list.
Plot Area Background Colors
This example shows how to customize the color of a plot area background.
1. Select the Plot Area checkbox, and then click in the field next to the default Solid color field to open the Default Color Set.
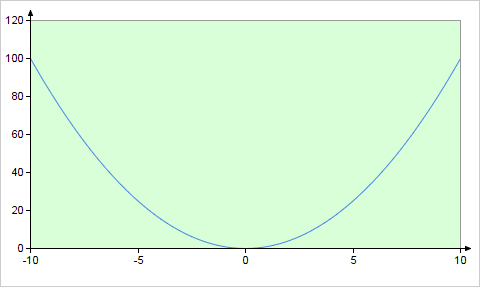
2. Click More Colors to open the RGB dialog box, and specify an RGB value of 200:255:200. The specified color is applied to the plot area background:
The specified color is added to the Recent Color list.
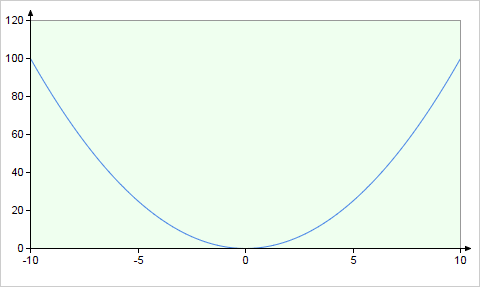
3. Under Opacity, change the default value of 70 to 30. The new opacity is applied to the background color:
4. Change the color type from Solid color to Gradient, and select a Gradient angle between -180 to 180 from the drop down menu.
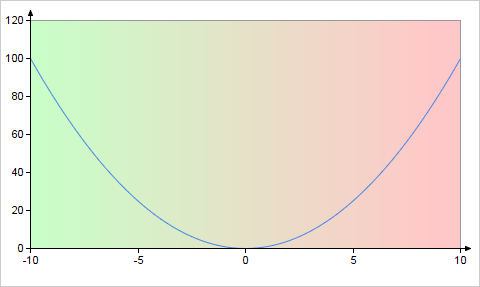
The chart below has the default gradient angle of 0 and Gradient start color of 200:255:200.
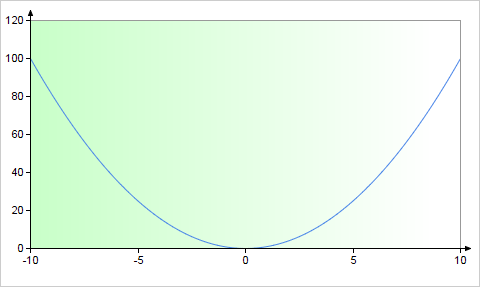
5. Click the Gradient end color field and specify an RGB value of 255:200:200. The end color is applied to the gradient:
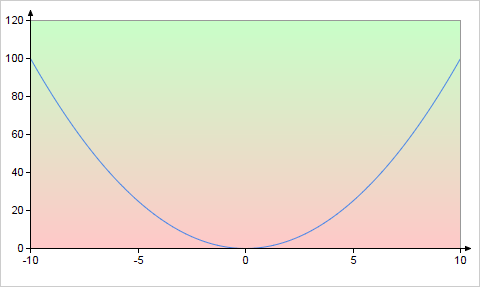
6. Change the gradient angle from the default value of 0 to -90. The new angle is applied to the gradient:
 , Styles tab, and then click Chart Background, Chart Border, Plot Area, or Plot Border.