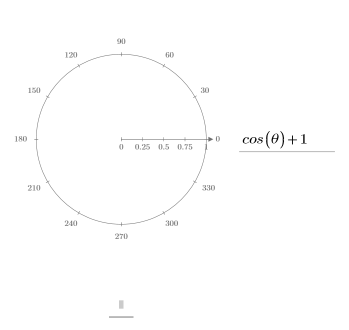
To Create a Polar Plot
1. In a worksheet, click where you want to create a polar plot.
2. Press Ctrl+4. An empty polar plot region appears.
Alternatively, on the Plots tab, in the Traces group, select Polar Plot from the Insert Plot list.
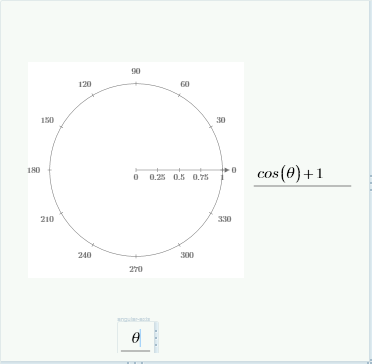
3. In the radial-axis placeholder (right), type a function or a radial expression in terms of an angle:
4. In the angular-axis placeholder (bottom), type another function in terms of the same angle:
5. Press Enter. The polar plot appears with a line trace.
| Vectors are graphed much as they are in X-Y plots, using range-variable subscripts. |