Polar plots enable you to view polar data in a 2D plot. You can control the traces by editing the tick marks on the radial axis.
Initially, PTC Mathcad treats negative radii as a phase shift in angle. You can edit the lower limit of the radial-axis to extend the radial scale to negative values.
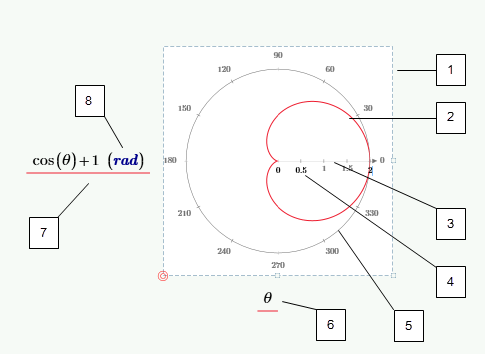
1. Plot region
2. Trace
3. Radial axis
4. Tick mark
5. Angular axis
6. Axis legend
7. Axis expression
8. Unit placeholder
Working with Polar Plot Parts
You can edit and format polar plots as you do for XY plots. There are however a few differences:
• Axes—The location of the axes are fixed. For the angular axis, you can only edit the interval between the angular axis tick marks. The tick marks are displayed in degrees.
• Trace Type—You cannot change the trace type of a polar plot. You can, however, change the trace style of a polar plot.
• Polar Plot Region—When you resize a polar plot region, the aspect ratio of the plot is always kept constant.
• Axis Expressions—When entered, the data is evaluated in radians unless you add the degree operator to the data definition.