|
|
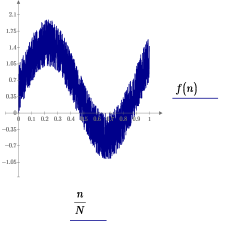
• The higher the number of overlapping data points, the darker the pixel appears in the density plot.
• If no data points fall on a particular pixel then that pixel is not filled with color.
|
|
|
• The higher the number of overlapping data points, the darker the pixel appears in the density plot.
• If no data points fall on a particular pixel then that pixel is not filled with color.
|
|
The Number of Data Points
|
Available Styles Options
|
What is Being Plotted?
|
|
0 – 4999
|
All trace formatting options are fully available.
|
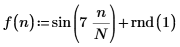
Each symbol represents a single data point.
|
|
5000 – 49999
|
Trace Color and Trace Thickness: Full availability.
Symbol and Line Style: Limited availability.
|
Each pixel represents one or more overlapping data points.
|
|
50000 – 2000000
|
You can only select the Trace Color.
|
Each pixel represents one or more overlapping data points.
|


Number of Data Points: 1 ≤ N ≤ 4999 | Number of Data Points: 5000 ≤ N ≤ 49999 | Number of Data Points: 50000 ≤ N |
 |  |  |
• One pixel represents one data point. • Available trace formatting options: ◦ Symbol ◦ Line Style ◦ Trace Color ◦ Trace Thickness | • One pixel represents one or more data points. • Available trace formatting options: ◦ Symbol (none) or solid circle only. ◦ Line Style (none) or solid line only. ◦ Trace Color ◦ Trace Thickness | • One pixel represents one or more data points. • Available trace formatting options: ◦ Trace Color |