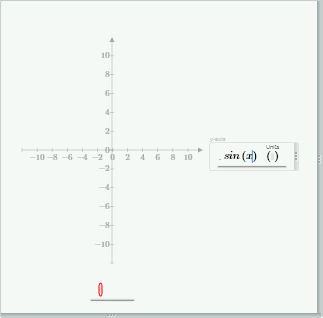
1. In a worksheet, click where you want to create a plot.
2. On the Plots tab, in the Traces group, click Insert Plot and select XY Plot. An empty XY plot region appears.
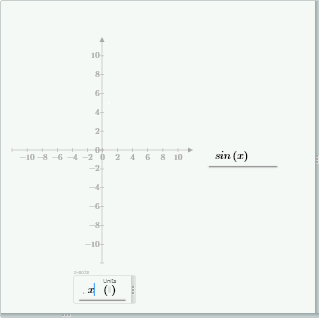
3. In the y-axis placeholder (right), type a function or the body of a function in terms of an independent variable:
4. In the x-axis placeholder (bottom), type another function in terms of the same independent variable:
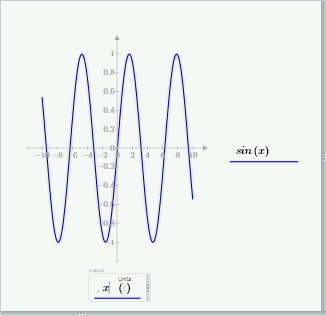
5. Press Enter. The plot appears with a line trace.
Additional Information
When you plot two functions one argument each, you can enter the function names without their argument. For example you can plot sin against cos instead of plotting sin(x) against cos(x).