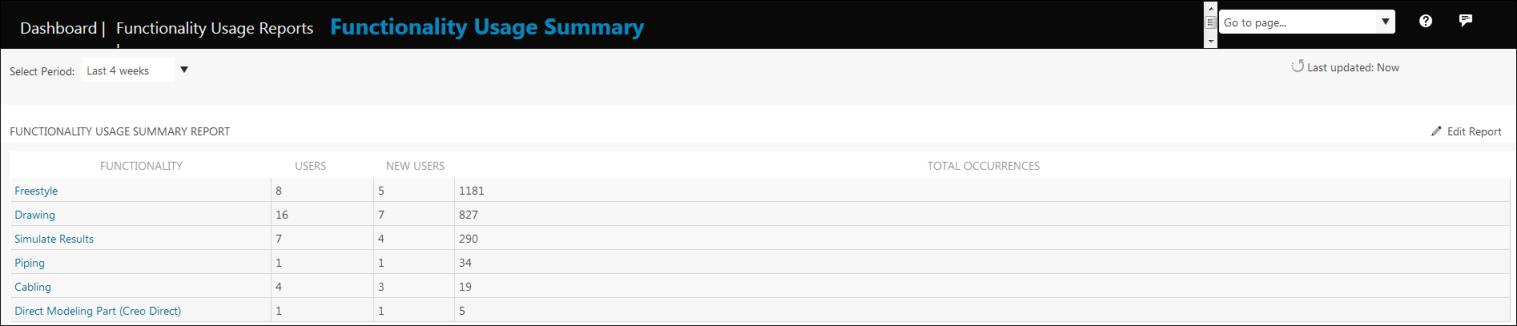
Functionality Usage Summary Report
The Functionality Usage Summary report displays information as shown in the example below. It provides detailed information for all the Creo functionality that was selected in the New Usage Report dialog box during report creation. The Functionality Usage Summary Report table displays the name of the Creo functionality, number of Users and New Users, and Total Occurrences.
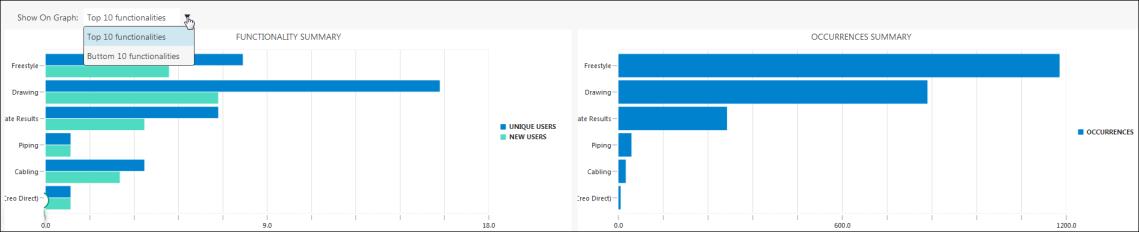
From the Show on Graph list, select Top 10 functionalities or Bottom 10 functionalities. Depending on your selection, the Functionality Summary graph and Occurrences Summary graph displays information for the top 10 or bottom 10 functionality. The Functionality Summary graph shows the number of unique and new users for the functionality. The Occurrences Summary graph shows the number of occurrences for the functionality.