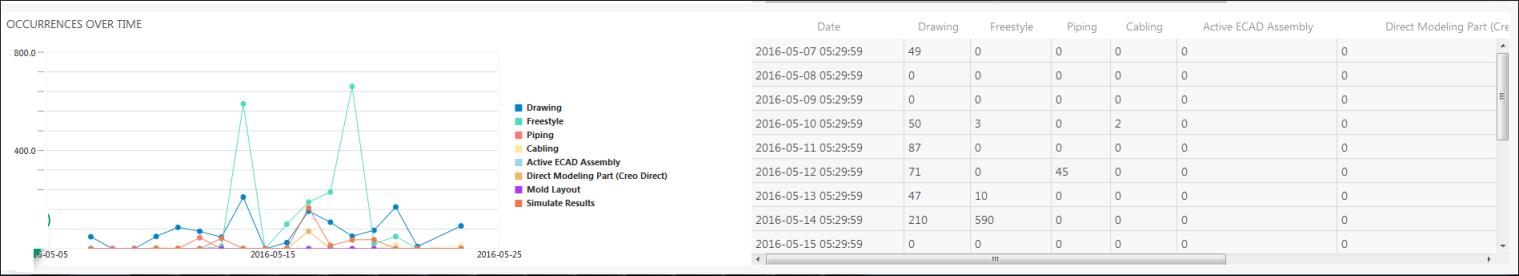
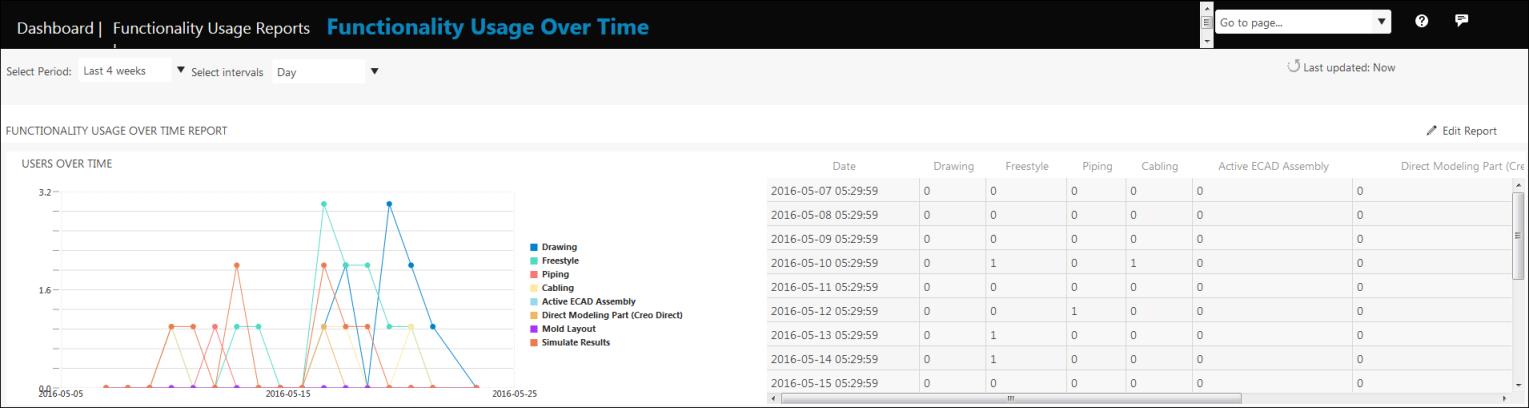
Functionality Usage Over Time Report
The Functionality Usage Over Time report displays information as shown in the example below. It contains a graph that shows the number of users over the selected time interval for the selected functionality. This information is also displayed in a tabular format.
Similarly, a graph of number of occurrences over the selected time interval is also displayed for the selected functionality. Information is also available in tabular format.