ModelCHECK Page
The ModelCHECK page provides information about the ModelCHECK usage data. Details about ModelCHECK usage is available at an organization level and at a user level. In the Go to page list, select ModelCHECK to view information about the ModelCHECK usage data.
|
|
The check configuration files of Creo ModelCHECK have a Metrics column reserved for metrics. The entry in the Metrics column (Y or N) determines whether Creo ModelCHECK stores metrics for the given check when it runs. From Creo 9.0 and later, Creo ModelCHECK usage data is collected by PTC Diagnostic Tools and sent to PTC. You can view this usage data in the Performance Advisor dashboards.
|
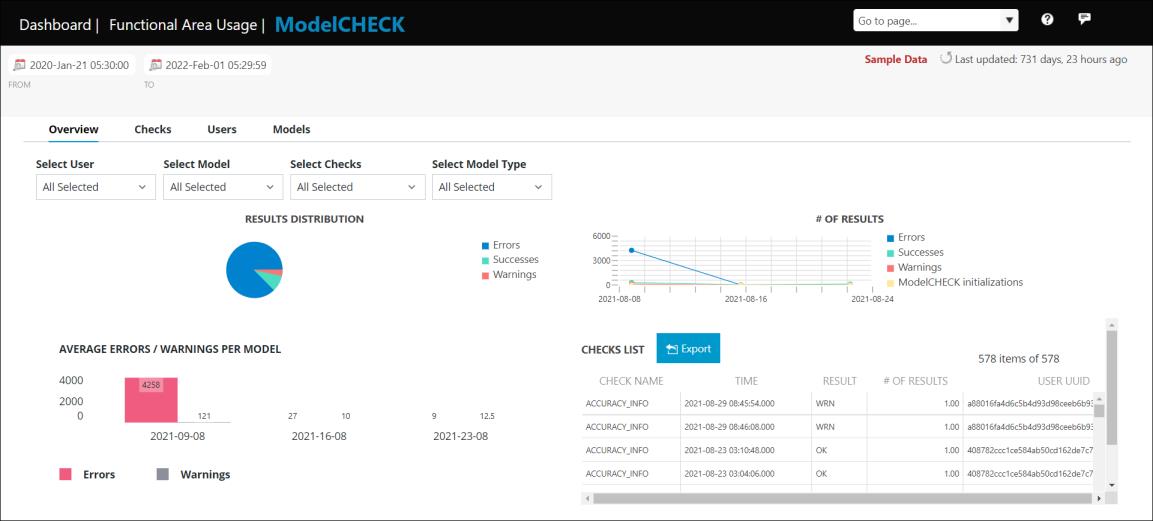
The Overview view displays details about the overall performance of the organization based on the ModelCHECK usage data. By default, the information for the last 4 weeks appears. You can change the time span.
The number of errors or warnings displayed for ModelCHECK results is the total error or warning count returned by the checks. For example, the LAYER_DTM_BLANK check may return an error or warning for 5 different datums. In such cases, the Creo Performance Advisor dashboards display the count as 5 errors or warnings for the LAYER_DTM_BLANK check. |
To display the overview information, perform the following steps:
1. In the Select User list, select the users.
2. In the Select Model list, select the models.
3. In the Select Checks list, select the checks.
4. In the Select Model Type list, select the model types.
The RESULTS DISTRIBUTION pie chart shows the distribution of results based on errors, successes, warnings, and information. Place the pointer over the pie chart to view the number of errors, successes, warnings, or information.
The # OF RESULTS line graph displays trends of overall check data. The graph displays the number of check results for errors, successes, warnings, information, and ModelCHECK initializations over the specified period of time.
The AVERAGE ERRORS / WARNINGS PER MODEL bar graph displays the trend of average errors or warnings per model for the entire organization.
The CHECKS LIST table displays the details of the checks performed on parts, drawings, and assemblies. It displays the following information:
• CHECK NAME – Name of the check.
• TIME – Time when the check was performed.
• RESULT – Result of the check.
• # OF RESULTS – Number of results generated for the check.
• USER UUID – Unique ID of the user.
• MODEL UUID – Unique ID of the part, assembly, or drawing.
Click Export to export the details of performed checks to a .csv file for additional analysis.
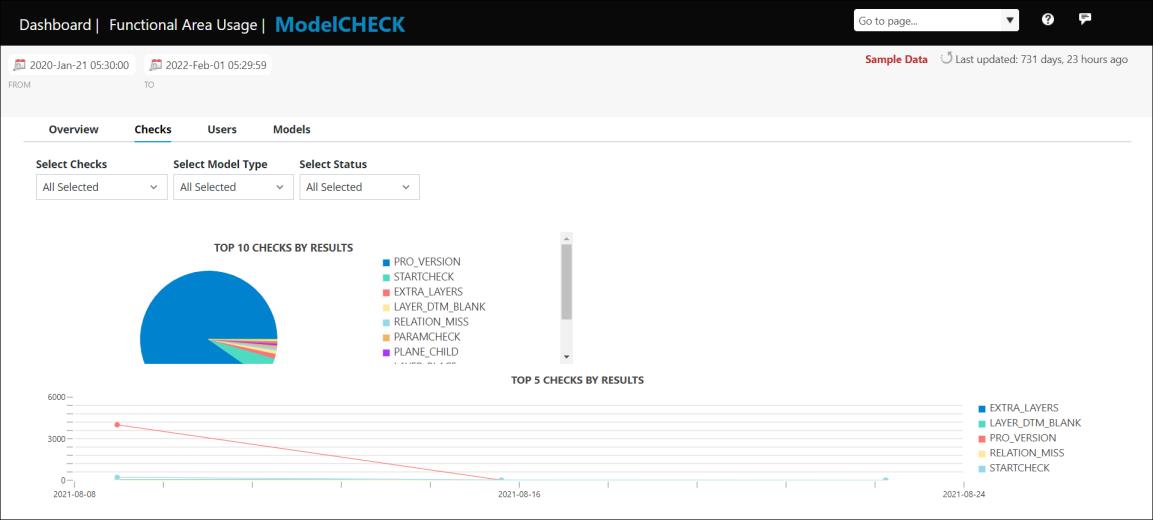
The Checks view displays the information on checks with the most errors, warnings, or successes. By default, the information for the last 10 days appears. You can change the time span.
To display information on checks, perform the following steps:
1. In the Select Checks list, select the checks.
2. In the Select Model Type list, select the model types.
3. In the Select Status list, select the status.
By default, the Error status is selected.
The Top 10 CHECKS BY RESULTS pie chart shows the top 10 checks based on number of check results for most errors, warnings, or successes. Place the pointer over the pie chart to view the number of errors, successes, or warnings per check. Select a slice of a specific check in the pie chart to view the check data. The check data is displayed in the corresponding line graph next to the pie chart. The line graph for the selected check displays the data on number of check results over the specified period of time.
The Top 5 CHECKS BY RESULTS line graph displays the top 5 checks with the most errors, warnings, or success over the specified period of time. Each line in the graph represents a check with the most errors, warnings, or success.
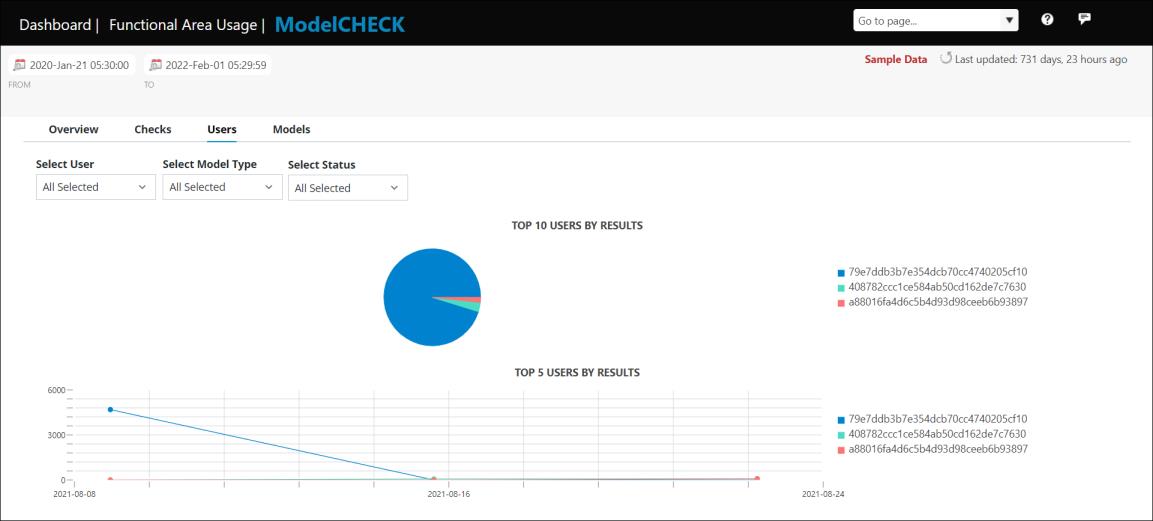
The Users view displays the information on users with most errors, warnings, or successes.
To display information on users, perform the following steps:
1. In the Select User list, select the users.
2. In the Select Model Type list, select the model types.
3. In the Select Status list, select the status.
By default, the Error status is selected.
The Top 10 USERS BY RESULTS pie chart shows the top 10 users based on the most number of errors, warnings, or success. Place the pointer over the pie chart to view the number of errors, successes, and warnings per user. Double-click a user in the pie chart to open the User page for the user. The User page additionally displays the ModelCHECK data for the user. For more information about the User page and the ModelCHECK data associated with the user, see User Page.
The Top 5 USERS BY RESULTS graph displays the line graph for the top 5 users with the most errors, warnings, and success over the specified period of time. Each line in the graph represents a user with the most errors, warnings, or success.
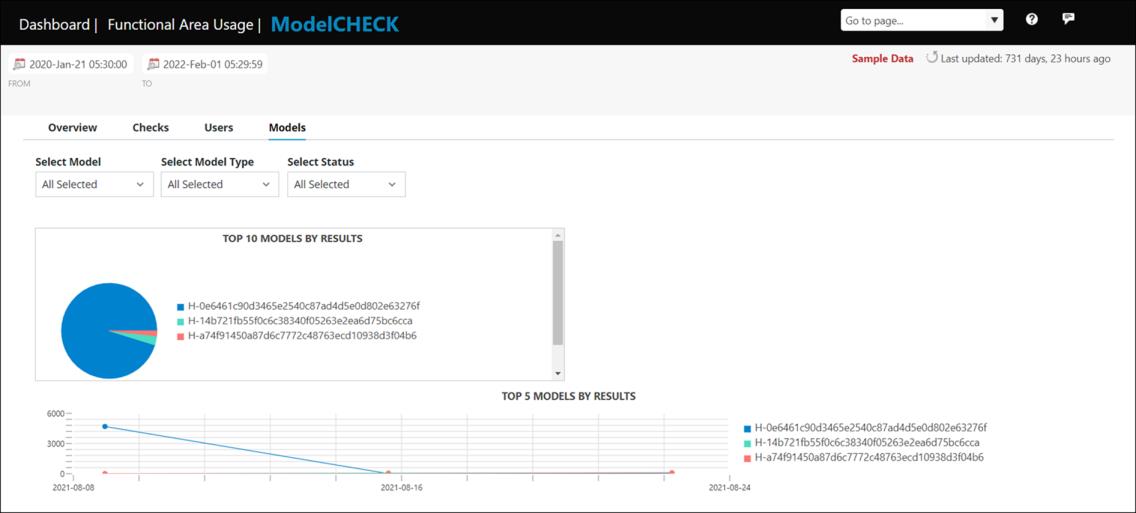
The Models view displays the information on the models with most errors, warnings, or success.
To display information on models, perform the following steps:
1. In the Select Model list, select the models.
2. In the Select Model Type list, select the model types.
3. In the Select Status list, select the status.
By default, the Error status is selected.
The Top 10 MODELS BY RESULTS pie chart shows the top 10 models with the most errors, warnings, or success. Place the pointer over the pie chart to view the total number of errors, successes, and warnings per model. Select a slice of a specific model in the pie chart to view the check data for the model. The check data is displayed in a table adjacent to the pie chart. The table displays the following information:
• User UUID – Unique ID of the user who used ModelCHECK on the model.
• # OF RUNS – Number of times the user initiated ModelCHECK for the model.
• ERRORS – Number of errors returned on the model corresponding to the user.
• WARNINGS – Number of warnings returned on the model corresponding to the user.
• SUCCESSES – Number of successes returned on the model corresponding to the user.
The corresponding MODEL DISTRIBUTED BY RESULTS line graph for the model displays the results distribution based on the selected statuses over the specified period of time.
The Top 5 MODELS BY RESULTS line graph displays the top 5 models with the most errors, warnings, or success over the specified period of time.