Toolkit Apps Usage Page
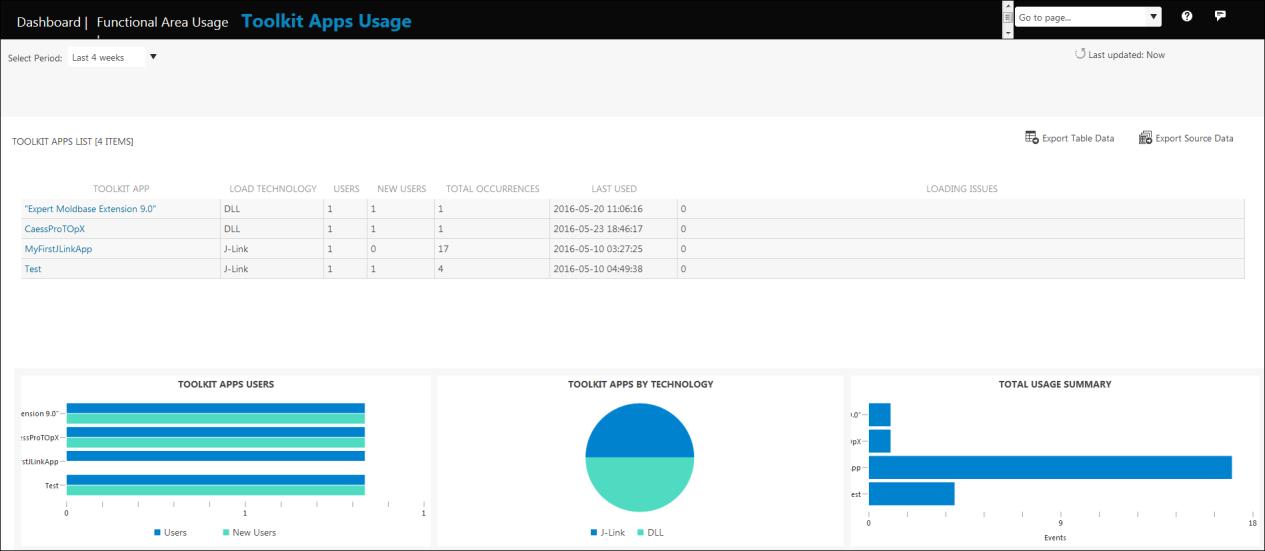
The Toolkit Apps Usage page provides information about the usage of Toolkit applications for Creo. In the Go To list, select Toolkit Apps Usage to view this information.

The Toolkit Apps List table specifies information about all the Toolkit applications being used. It displays the following information:
• Toolkit App—The name of the Toolkit Application.
• Load Technology—The technology used to load the application.
• Users—The number of all users who used the Toolkit application once or more times in the specified time period. It includes users who used the functionality in the time period, just prior to the current period, and new users.
• New Users—The number of new users. The new users are the users who have not used the Toolkit application in the time period just prior to the current period. They may have used the functionality in some other time period.
• Total Occurrences—The number of times the Toolkit application was used in the selected period.
• Last Used—The date and time of the session when the Toolkit application was last used.
• Loading Issues—The number of issues encountered while loading the Toolkit application.
The Toolkit Apps Users graph shows the number of unique and new users for the Toolkit applications.
The Toolkit Apps By Technology pie chart shows the Toolkit applications based on the loading technology.
The Total Usage Summary graph shows the usage of Toolkit applications.
Click a specific Toolkit application to drill down into additional details for the Toolkit application. The Toolkit Apps Usage Details Page opens.
Click Export Table Data to export the data displayed on the page to a .csv file for additional analysis.
Click Export Source Data to export all source data to a .csv file for analysis. Source data includes information about all the sessions in which the Toolkit applications were used. Sessions includes information about user sessions, machine sessions, and so on. This export may take a couple of minutes due to the large amount of data being exported.