Slippage Indicator Measures
Creo Simulate creates three slippage indicator measures if you select the Create Slippage Indicators check box while defining a contact interface with infinite or finite friction. These measures are rough indicators of a slippage condition in the contact region. During a static analysis, Creo Simulate computes the values of the slippage indicator measures. A positive value of a measure indicates that slippage or sliding has occurred in the contact region.
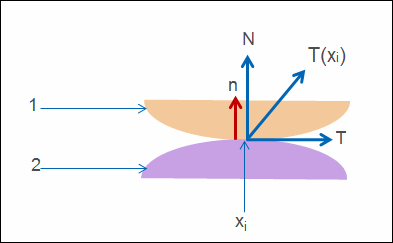
The diagram shows two surfaces in contact. Creo Simulate calculates the values of the slippage indicator measures as follows:
• 1. Surface 1 in contact
• 2. Surface 2 in contact
• n—The vector normal to the surface at point xi
• xi— The ith sampling point on a surface in contact
• t(x i)—The traction vector at xi
• N—The normal component of Traction vector
• T—The tangential component of Traction vector
The slippage condition at xi is as follows:
S
i=T—N*

<= 0
where

is a coefficient of friction.
Slippage does not occur at xi when the value of Si is less than or equal to zero. Creo Simulate calculates Si at every point of the surface and uses Si to calculate the following slippage indicator measures:
• Any Slippage—Maximum of Si
A positive value of this measure indicates that slippage has occurred at at least one location in a contact region.
• Complete Slippage—Minimum of Si
A positive value indicates that slippage has occurred at all locations in a contact region.
• Average Slippage—Integral of Si over the contact surface.
A positive value indicates that slippage has occurred at most of the locations in a contact region.
This measure is created when both the surfaces in contact are planar.
If any of these measures show a positive value during the analysis with infinite friction, Creo Simulate writes a warning message in the summary report. This warning indicates that the surfaces in contact may have slid relative to each other. The assumption of infinite friction is not accurate in this case.
Creo Simulate also calculates the Maximum of T in a contact region and reports this value as Max Tangential Traction. Creo Simulate calculates T for any contact with infinite or finite friction.


 <= 0
<= 0 is a coefficient of friction.