Best Practice: Using Failure Index Results to Predict Material Failure in a Model
Defining Failure Criterion for a Material
You can use the failure index results quantity to determine if a material will fail under loading conditions. If the failure index is equal to or greater than 1, it means the material fails. The failure index results quantity is available only in Native mode.
In order to use the failure index results, you need to ensure that you have performed the following steps:
1. If you have assigned an isotropic material to your model you must specify one of the following failure criterion on the Material Definition dialog box:
|
|
 As a general rule, distortion energy (von Mises) and maximum shear stress (Tresca) failure criteria are used in the definition of ductile materials, and the Modified Mohr failure criterion is used in the definition of brittle materials. |
If you have assigned a transversely isotropic material to your model, then you must specify one of the following failure criterion on the Material Definition dialog box:
These failure criteria are valid only for 3D shells.
2. Ensure that you have defined the necessary material limits for the selected failure criterion—the failure index is calculated based on the material limits for a particular failure criterion. Refer to the Related Links at the end of this topic, for details of the material limits for a particular failure criterion.
3. Click Home > Measures to open the Measure Definition dialog box and select Failure Index as the measure quantity if you want to create failure index measures. You can define failure index measures at specific points or define the maximum or minimum failure index measure over the model.
4. Define an analysis and ensure that you have selected the Stresses check box on the Output tab of the analysis definition dialog box.
5. After you run the analysis, select the quantity Failure Index on the Result Window Definition dialog box to view the failure index graph or fringe plot.
Example: Displaying Failure Index Results for a 3D Model
Consider the following example:
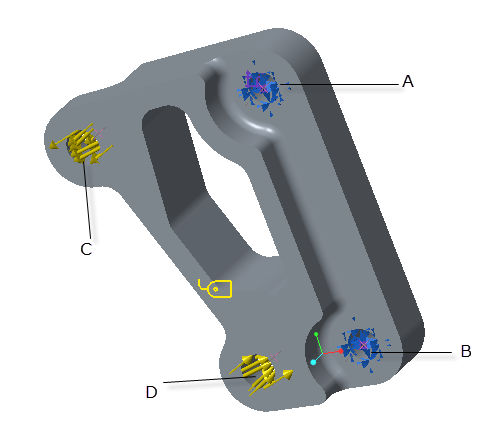
The 3D model has an isotropic material AL 2014 assigned to it. The failure criterion for the material is distortion energy (Von Mises). The inner surfaces of the two holes A and B are constrained for translational motion in the X-, Y-, and Z- directions. The holes are unconstrained for rotational motion. A force load of the type Total Load at Point is applied to a point on the inner surfaces of the two holes C and D.
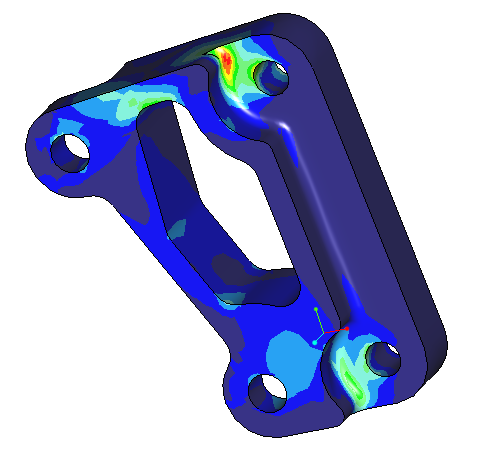
A static analysis is run on the model. Figure 2 shows a fringe plot of the failure index for the model.
|
|
|
Fig 1
Inner surfaces of holes A and B are constrained for translational motion in the X-, Y- and Z- directions.
A total load at point is applied at points on the inner surfaces of holes C and D.
|
Fig 2
Fringe Plot of failure index for the model.
|

