The Bathtub Curve
The bathtub curve is a graph of failure rate versus time that illustrates the failure rate tendencies of an item over its life span. Components, like people, have a life expectancy. In the case of components, the terms service life or design life better indicate that a component’s life expectancy is how long it was designed to last. For the design life of the component, the failure rates in three distinct phases are compared. The bathtub curve is produced when the failure rate curves for these three phases are combined.

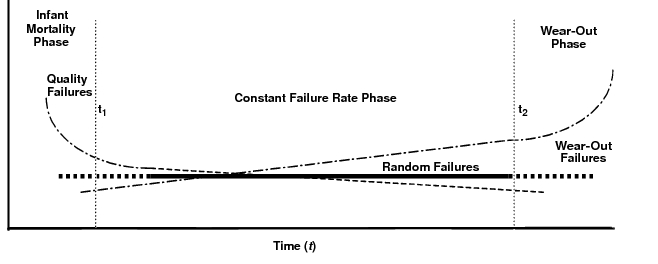
The derivation of the bathtub curve is illustrated in the figure below. Initially, failures of a component placed in service are typically caused by quality-related issues. As the infant mortality phase progresses, the number of failures is drastically reduced because the causes of these quality-related failures are quickly identified and corrective action is taken. Later, as the component ages, it enters the wear-out phase, where the number of failures significantly increases with time. Between the infant mortality and wear-out phases is the constant failure rate phase. This phase, which is also known as the useful period, is where a constant (random) failure rate is experienced.

Reliability prediction calculation models do not consider all three phases of life represented by the bathtub curve. They are based solely on the constant failure rate region of the curve. While Telcordia and prior Bellcore models provide the ability to calculate a first year drop out value that summarizes the infant mortality phase, this calculation is a separate analysis, not a part of the failure rate calculation. The Prediction module supports using the Telcordia method for calculating a first year drop out value with any model but a FIDES, IEC TR 62380, or RDF 2000 model. |
Failure Rate Tendencies
The following table describes the failure rate tendencies for each phase of the bathtub curve.
Phase | Description |
|---|---|
Infant mortality | The infant mortality phase is sometimes referred to as the decreasing failure rate (DFR) region. In this phase, the curve typically begins with high failure rates that drop drastically as the component nears the end of its infancy. High failures in the infant mortality phase are typically caused by poor design. These failures are generally eliminated as the design becomes mature. |
Constant failure rate | The constant failure rate phase is typically a flat graph representing the constant failure rate (CFR) of a component during the “steady state” of the item’s operating life. This is the phase in which the component spends most of its life. When running prediction calculations, the failure rate calculated is for the CFR region. Calculation models do not consider the failures in the CFR region that are typically caused by stress. |
Wear-out | The wear-out phase is sometimes referred to as an increasing failure rate (IFR) region. In this phase, the curve begins with very low and consistent failure rates that increase drastically as the component ages and approaches the end of its life. Fatigue or wear-out typically causes these failures. |