Analysis Page
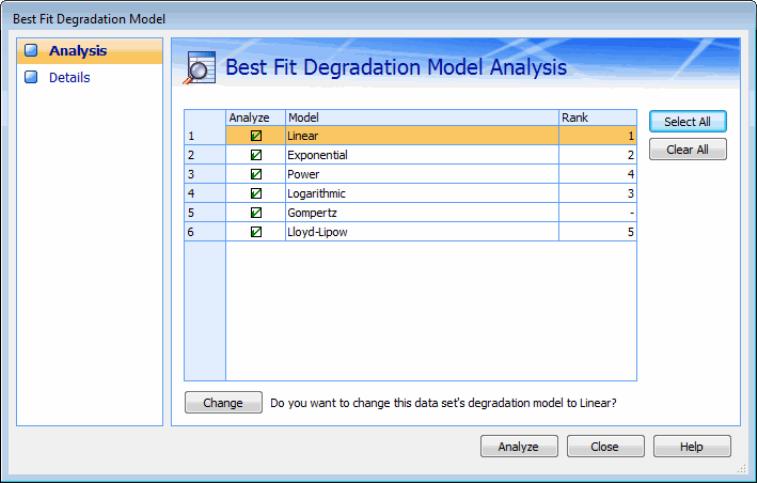
In the Best Fit Degradation Model Analysis window, the Analysis page specifies the degradation models to consider in the best fit analysis. By default, all models are selected. In this case, when you click Analyze, the fit of the data points in the active data set is evaluated for all models. You can click Select All or Clear All to select or clear all models and then customize your selections from there.

Clicking Analyze on either property page in the Best Fit Degradation Model Analysis window evaluates the selected models to determine how well they fit the data in the data set. One the analysis is complete, the Analysis page displays the ranking results for the selected models in the Rank column. If a model other than the one currently selected in the Weibull Parameters pane has a higher rank, a Change button and a message indicating the model with the best fit are shown. On the Details page, the calculation results are shown. For more information, see Details Page. To change to this model, you click Change on the Analysis page.

If a selected model is excluded from the analysis because of invalid data or parameter values, a dash (-) is shown for Rank. For example, in the previous figure, a dash appears for the Gompertz model because the data for the selected data set does not support the use of this model. Rank is left blank for any model that you intentionally excluded from the analysis.