Markov Diagrams
Markov diagrams consist of system states, the possible transitions between these states, and transition rates. Using a Markov tool, you create Markov diagrams to define the good, failed, and degraded states and the transitions between these states. The initial state is generally a good state where all components are operational (although this does not have to be the case). The system starts from this initial state, and, based on the events that can occur in the system, one of these events leads to the transition to the next state. Once properties are assigned to all states and the transitions between states, the Markov diagram contains sufficient information for developing equations to represent the model.
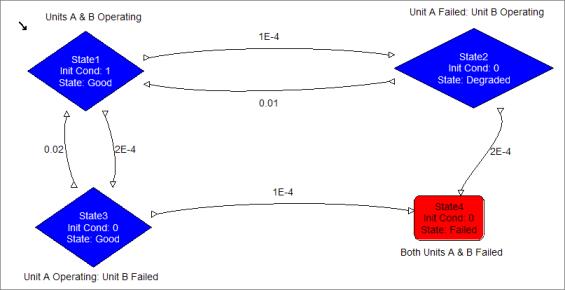
For example, let’s consider at a two-unit parallel non-repairable system where both units are in operational condition (State1). Two events can occur in this state: the first unit (Unit A) can fail, or the second unit (Unit B) can fail. An occurrence of either of these events changes the system state from the initial state to the first-level failure state. If Unit A fails, then the next state of the system (State2) represents Unit A failed and Unit B operational. Similarly, if Unit B fails, the next state of the system (State3) represents Unit B fail and Unit A operational.

When the system is in State2, two possible events can occur: Unit A can be repaired or Unit B can fail. After repair of Unit A, the system will once again be in State1. However, if Unit A is not repaired and Unit B fails, the system will reach State4, where both components are in failed states. Similarly, when the system is in State3, two possible events can occur: Unit B can be repaired or Unit A can fail. After repair of Unit B, the system will once again be in State1. However, if Unit B is not repaired and Unit A fails, the system will reach State4. If the system is non-repairable, then it stays in a failed state once reached. Therefore, no repairs are allowed from the failed state to good states.
You can use this approach of considering each component and its possible states and system failure criteria (in general events in the system and their effects) to build a state transition diagram of any system (behavior). Once such a diagram exists, the powerful Markov engine uses the properties assigned to the states and transitions to construct equations for computing dozens of values. For more information, see Markov Calculations.