Weibull Forecast Pane for a Warranty Data Set
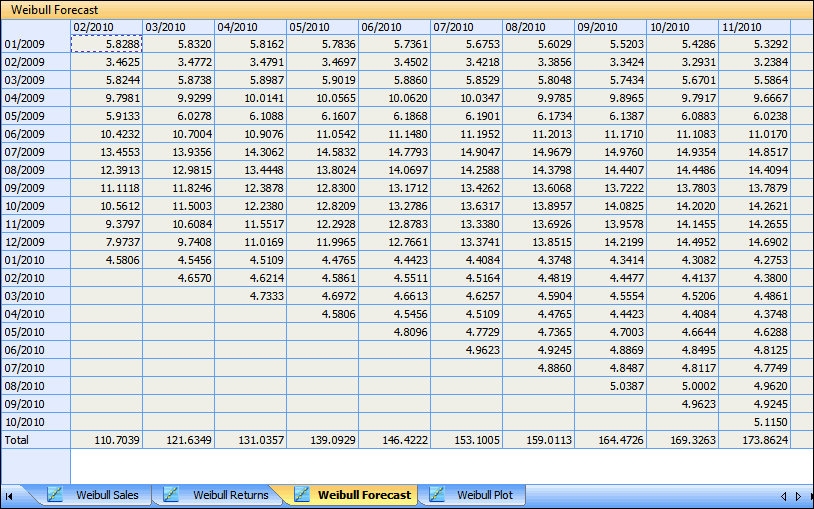
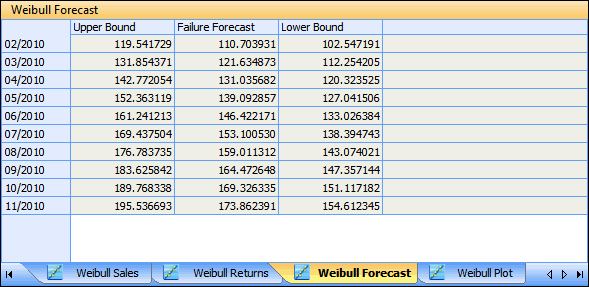
After providing parameter values in the Forecast Parameters pane, you click the first button in the title bar to calculate the data set. Once the warranty data set is calculated, you can view results in the Weibull Forecast pane. The results shown depend on your selection for Display in the Forecast Parameters pane.
• When Forecast, Upper Bounds, or Lower Bounds is selected, in the Weibull Forecast pane, a row with results for the selected calculation result is shown for each sales period, plus a row with totals is shown. Additionally, a column is shown for each increment specified for forecasting when the data set was inserted.

• When Summary is selected, in the Weibull Forecast pane, a row for each sales period is shown. Additionally, the following three columns are shown: Upper Bound, Failure Forecast, and Lower Bound. These values represent the total values from the tables generated by selecting Forecast, Upper Bounds, and Lower Bounds.
