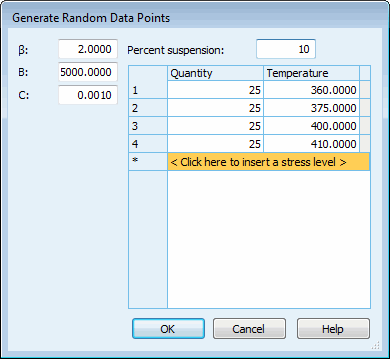
Generate Random Data Points Window for an ALT Data Set
The Generate Random Data Points window is used by both this module and the Weibull module. When you select > to open this window, the data set that is active determines the parameters that the Monte Carlo simulation engine requires to generate random data points. The following figure shows the Generate Random Data Points window for an ALT data set with two stress columns: Temperature and Voltage. Based on the parameter values shown in the following figure, 100 random data points are to be generated with the specified stress values.

The following table describes all parameters that can appear in the Generate Random Data Points window for an ALT data set. Once you complete this window, you click OK. Once the data points are generated, they can be viewed and modified in the ALT Data Points pane.
Option | Description |
|---|---|
Parameter The area to the left of the table provides for specifying parameter values for the generated data points. The values required depend on selections made in its ALT Parameters pane. The defaults are the values currently specified for the data set. | |
[Slope parameter] | A slope parameter is required when either Weibull or Lognormal is selected as the distribution for the data set. The default is the calculated or specified value shown in the ALT Parameters pane. • For Weibull, β is the shape parameter. • For Lognormal, σ is the shape parameter. |
[model parameters] | The parameters for the life stress model selected in the ALT Parameters pane. For example, when Arrhenius is selected, values for B and C are specified. For more information, see Life Stress Model Parameters. |
Percent suspensions | Shown only if the current data set has suspensions, indicates how many suspensions to include in the generated data. For example, if you enter 10, 10 percent of the data points generated are suspensions. The default value is 0. |
Table Columns The table contains the Quantity column and 1 to 10 stress columns, depending on selections made in the Stress Model window. For more information, see Stress Model Window. Clicking Click here to insert a stress level in the last table row inserts a new record. For each record, you specify the number of data points to generate and the stress data to assign to these data points. | |
Quantity | The number of data points to generate. The default for a newly inserted row is 0. |
[Stress 1 through Stress X] | In each stress column that is shown, either enter a value or select the stress profile to assign to data points. • For a constant stress, you enter a stress value. The previous figure demonstrates the entry of values for a constant stress. • For a time-varying stress, you select a stress profile. The following figure demonstrates the selection of a stress profile. For more information, see Stress Profiles.  |