Support for Creating Charts for Jasper Reports
Jasper supports a wide variety of chart types: Area, Bar, Bar 3D, Bubble, Candlestick, Gantt, Open-High-Low-Close, Line, Meter, Pie, Pie 3D, Scatter, Stacked Area, Stacked Bar, Stacked Bar 3D, Thermometer, Time Series, XY Area, XY Bar and XY Line charts.
This section provides information on:
• Steps to load a sample Jasper Report in Windchill
• Creating sample data sets
• Creating sample charts
Steps to Load a Sample Jasper Report in Windchill
|
|
For this example, sample Jasper Reports are created in Jasper Studio. This reports refers to Windchill ReportTemplate (QML) for data sets and its files are located under JasperIntegration/src_example directory.
|
1. Create a new folder named Sample in $WT_HOME/codebase/JasperReports directory.
2. Copy all JRXML files starting with file name Demo under the following directory:
$WT_HOME/prog_examples/JasperIntegration/JasperReports/Sample
to:
$WT_HOME/codebase/JasperReports/Sample.
3. Copy loadAllJasperChartSamples.xml file under the following directory:
$WT_HOME/prog_examples/JasperIntegration/loadFiles/reports/jasper
to:
$WT_HOME/loadFiles/reports/jasper.
4. Copy all QML files under the following directory:
$WT_HOME/prog_examples/JasperIntegration/loadFiles/reports/jasper
to:
$WT_HOME/loadFiles/reports/jasper.
5. Execute the following command to compile each JRXML file:
windchill com.ptc.wbr.jasper.util.JRXMLCompiler $WT_HOME/codebase/JasperReports/Sample/jasper_report_file.jrxml
For example,
windchill com.ptc.wbr.jasper.util.JRXMLCompiler $WT_HOME/codebase/JasperReports/Sample/Demo3DBarChart.jrxml
|
|
Before proceeding to the next step ensure that the method server is running in the background.
|
6. Execute the following command to load the Jasper Report in Windchill:
windchill wt.load.LoadFromFile -u wcadmin -p wcadmin -d loadAllJasperChartSamples.xml
|
|
Restart of method server is not required after loading of Jasper Report.
|
7. To view the sample Jasper Report, navigate to > > in Windchill.
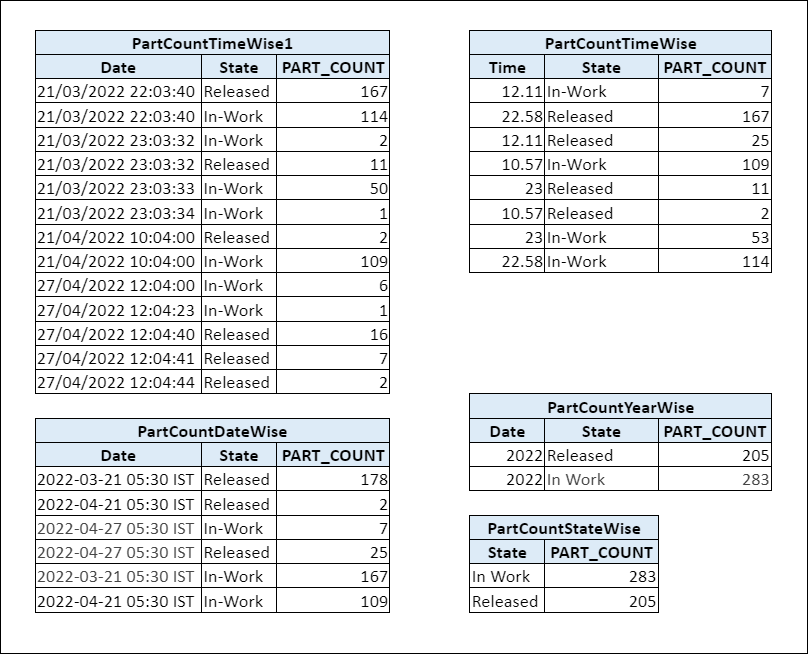
Sample Data Sets
The following data sets are used for rendering sample charts.
Sample Charts
In the following table, sample charts are created using sample data sets, and rendered using libraries of JasperReports and jFreeChart-1.0.19. You can choose to display your charts in multiple output formats, such as PDF, HTML, and Microsoft Excel.
• Charts shown below are for illustration purpose only. Actual charts may vary depending on your data sets. • Accuracy of charts can be improved using correct and comprehensive data sets. • Candlestick, Gantt and Open-High-Low-Close charts are also supported. However, they are not shown in the table below due to unavailability of matching data sets (for example, Share market and Project management data sets). You can create relevant data sets to view these types of charts. |
Chart Type | JRXML File Name | Sample Report Template | Sample Chart |
|---|---|---|---|
Area | DemoAreaChart.jrxml | PartCountTimeWise |  |
Bar | DemoBarChart.jrxml | PartCountStateWise | 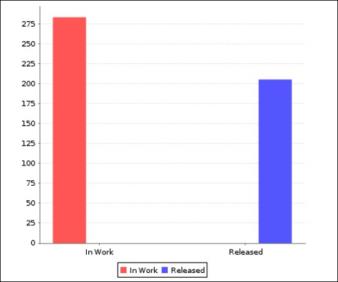 |
Bar 3D | Demo3DBarChart.jrxml | PartCountStateWise | 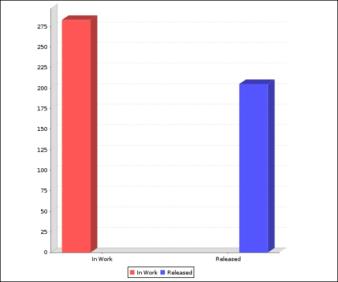 |
Bubble | DemoBubbleChart.jrxml | PartCountStateWise | 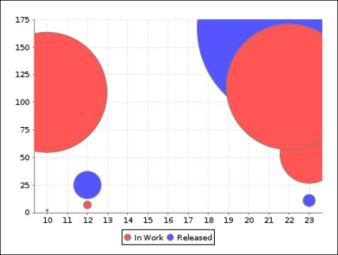 |
Line | DemoLineChart.jrxml | PartCountTimeWise | 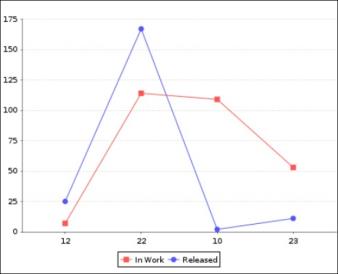 |
Meter | DemoMeterChart.jrxml | PartCountStateWise | 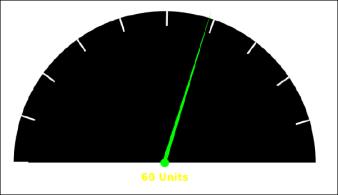 |
Pie | DemoPieChart.jrxml | PartCountStateWise | 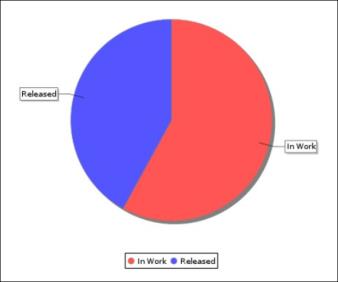 |
Pie 3D | Demo3DPieChart.jrxml | PartCountStateWise | 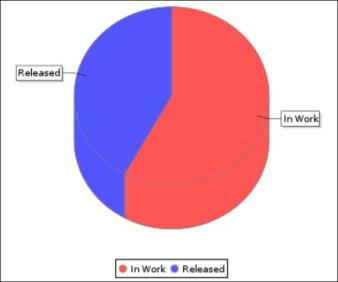 |
Scatter | DemoScatterChart.jrxml | PartCountTimeWise |  |
Stacked Area | DemoStackedAreaChart.jrxml | PartCountTimeWise | 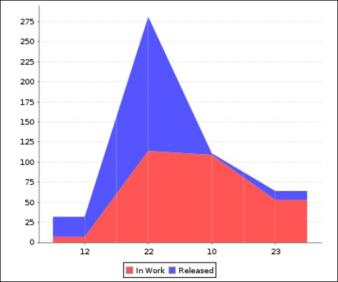 |
Stacked Bar | DemoStackedBarChart.jrxml | PartCountTimeWise | 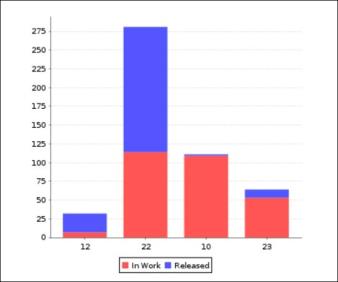 |
Stacked Bar 3D | DemoStacked3DChart.jrxml | PartCountDateWise | 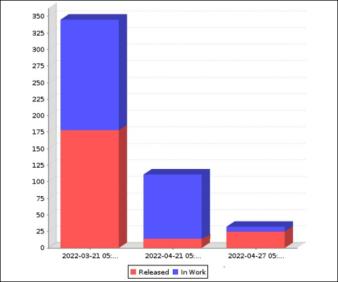 |
Thermometer | DemoThermoMeterChart.jrxml | PartCountStateWise | 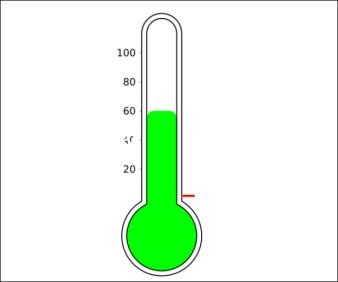 |
Time Series | DemoTimeSeries.jrxml | PartCountTimeWise1 | 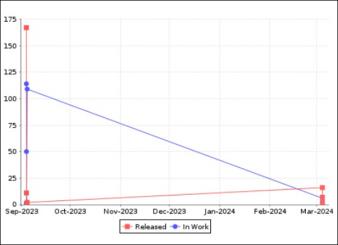 |
XY Area | DemoXYAreaChart.jrxml | PartCountTimeWise | 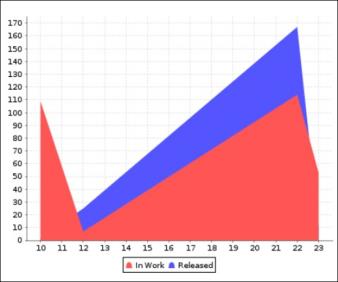 |
XY Bar | DemoXYBarChart.jrxml | PartCountYearWise | 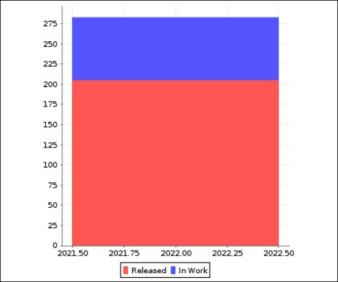 |
XY Line | DemoXYLineChart.jrxml | PartCountTimeWise | 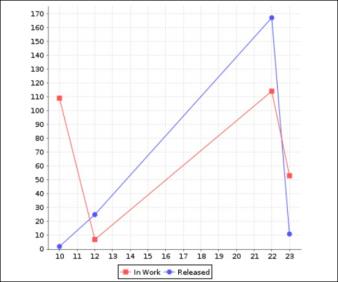 |