Using the Persisted Log Events Page
As a result of an end user clicking Send on the prepared end user error email, administrators listed in the To field receive the email. The email received contains the following information:
• Email subject containing Windchill Error - Servlet request id: followed by the ID.
• Email body containing a URL to the user error report page. This report page has the title of Persisted Log Events.
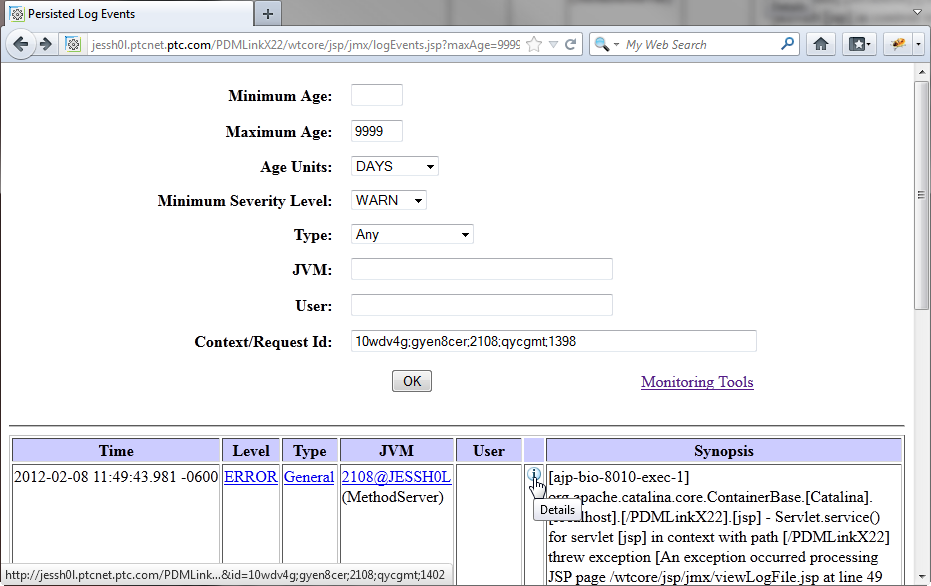
Use the URL that is presented in the body of the email to open the Persisted Log Events page. If the URL is presented as a link, you can click the link to open the page. If it is not a link, copy the URL from the email and paste it into a browser address field. For example, the link copied from the previous email opens the following:
The Persisted Log Events page contains the following categories of information:
• General information about the user error, including age, severity, type, and servlet request ID.
• An OK button that can be used if you update the details in the input fields. Clicking OK re-executes the query based on the values in the fields. The results of the query is displayed in the table.
• A link to Monitoring Tools.
• A table containing the specific details about the error. The columns include the time, level, type, JVM, link to details through the Details icon, and Synopsis column.
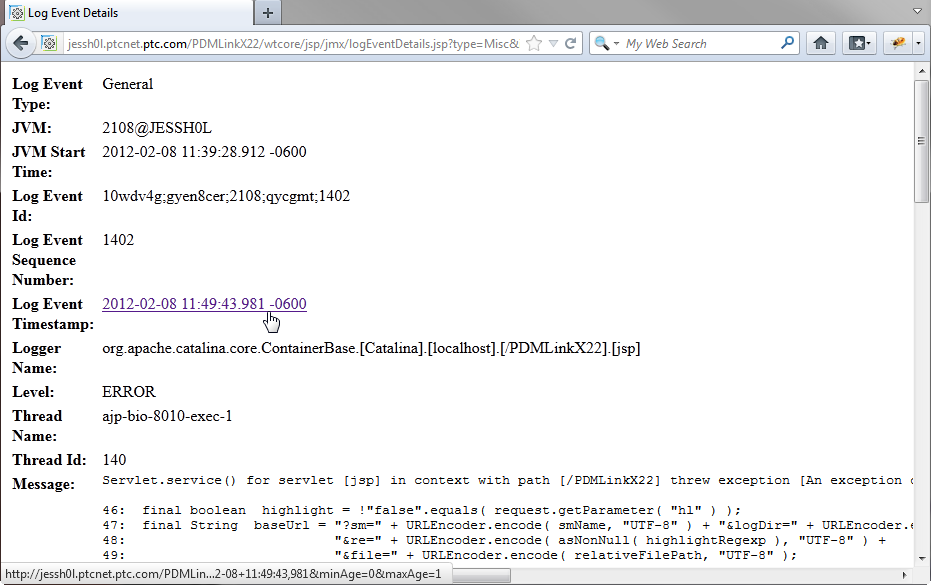
◦ Clicking the Details icon opens a Log Event Details page, which is described later in this topic.
◦ The Synopsis column contains the stack trace related to the error.
The Log Event Details page provides additional tracing information. As shown in the following screen shot, you can select the log event timestamp to view the relevant portion of the detailed log data from the page:
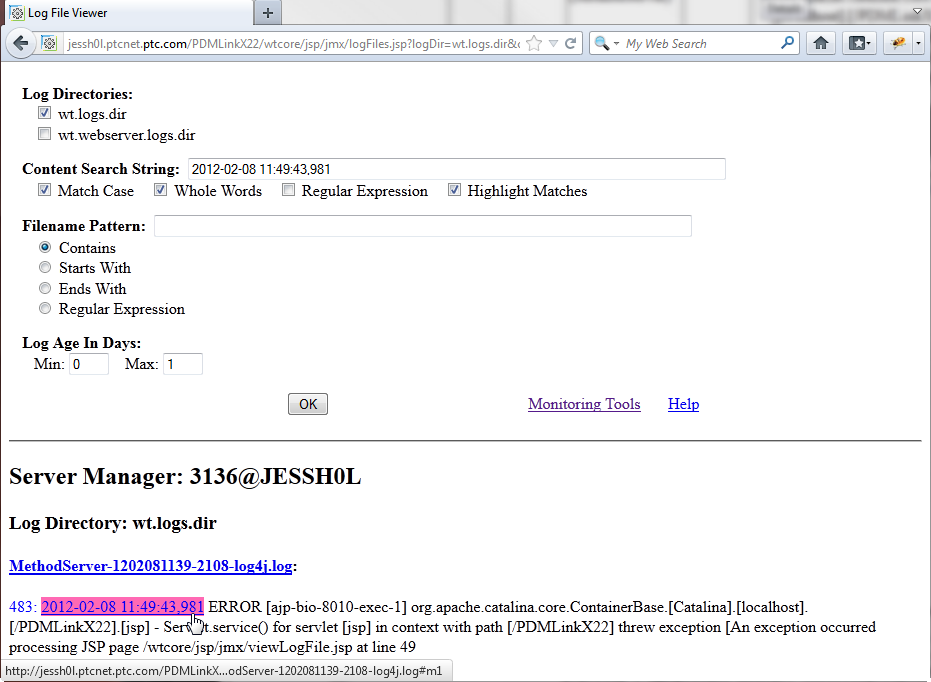
Clicking the Log Event Timestamp link opens the Log File Viewer page with pertinent information listed in the fields and details from the identified log file displayed. For example:
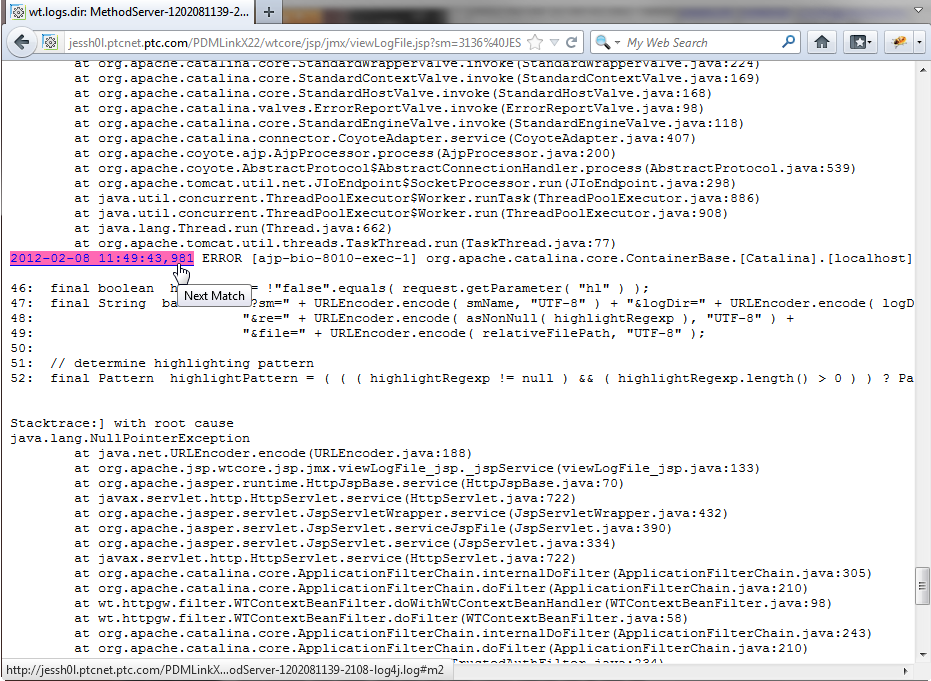
Clicking the highlighted link opens the log file and positions the viewer so that you can see the first occurrence of the log event timestamp. For example:
Upon investigating where the error occurred, you can decide what action should be taken. For potential actions, see
Related Administration Activities.