Creating a Computed Expression in a Chart
You can create computed expressions in charts to perform calculations on item data. This is particularly useful when you do not have permission or the ability to create a computed field in an item type that performs a similar calculation.
Example: Cost Summary of Active Projects
In a distribution chart, use aggregate functions to calculate a cost summary of active projects for each product.
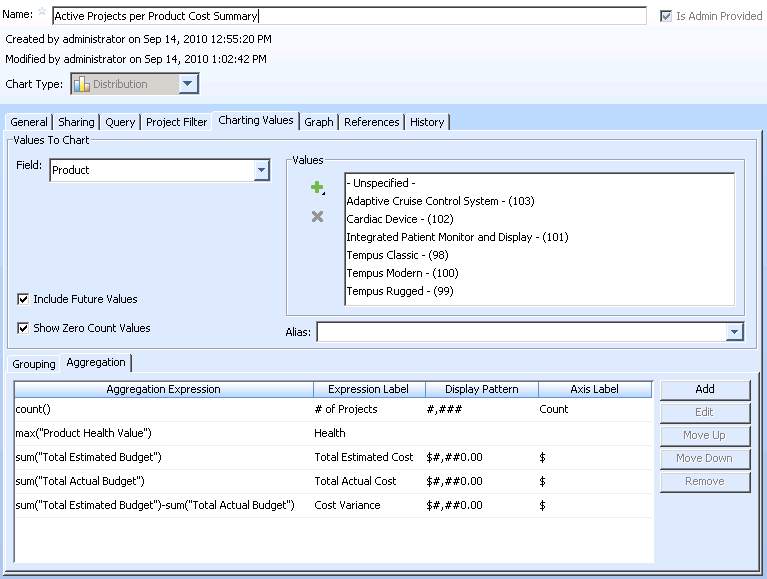
For example, in the Edit Admin Chart window, the following aggregate expressions display in the Aggregation panel:
Summary of aggregate expressions:
• count() - displays the number of active projects for each product.
• max(“Product Health Value”) - displays the Health of each product by calculating the maximum value of the Product Health Value computed field in each active project.
• sum(“Total estimated Budget”) - displays the Total Estimated Cost of a product by calculating the sum of the Total Estimated Budget field in each active project.
• sum(“Total Actual Budget”) - displays the Total Actual Cost of a product by calculating the sum of the Total Actual Budget field in each active project.
• sum(“Total estimated Budget”)-sum(“Total Actual Budget”) - displays the Cost Variance for a product by calculating the difference between the Total Estimated Budget field and Total Actual Budget field in each active project.
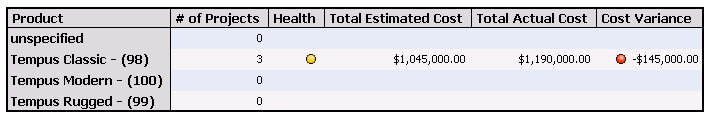
The generated chart displays the following data: