To create a dashboard
1. Select on of the following:
◦ >
◦ > >
The Create Dashboard dialog box displays.
2. Provide information for the
Name field, and the
Description,
Sharing, and
Project Filter tabs. For more information, see
“Dashboard Properties”.
3. To begin designing your dashboard, click Edit Layout. The Edit Dashboard Layout dialog box displays.
4. To set global layout properties, click

. The
Layout Properties dialog box displays.
| By setting global layout properties, you can avoid having to configure detailed settings for each individual element of your dashboard and instead have a consistent style that is applied to all instances of a text, cell, or grid element. All global dashboard properties can be overridden for individual components. For detailed information on the fields in the Layout Properties dialog box, see the following: |
5. To add a new grid to your dashboard, drag the grid tool

onto the design pane. The
New Grid dialog box displays.
6. Set the size of the grid by entering the number of rows and columns, and click OK. The new grid is inserted on the design pane. The default properties of the grid display in the properties pane.
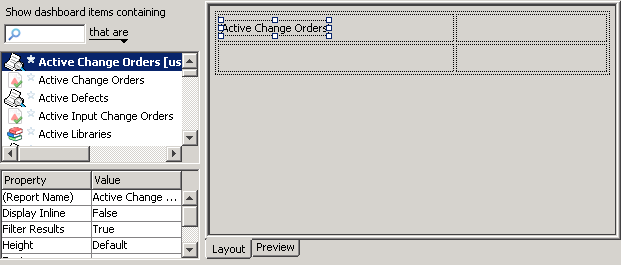
8. To add an embedded chart, an embedded report or report link, or a query link to the dashboard, select the appropriate type from the components filter list. The components view pane displays the components associated with the selection that are available to you. For example, if you specified a chart component type, all charts created by you or shared with you display in the components view pane.
9. Select a component, and drag it into the target cell of the grid. The default properties for the component display in the properties pane.
| • If you decide to leave empty cells in the grid, empty space displays in the dashboard for both the GUI and Web interface. • When you insert a chart in the grid, it shows at its requested size with a placeholder image and border. Actual chart data can be viewed by previewing the chart. |
10. In the properties pane, modify the properties of the component as required. For detailed information on the properties for charts, reports, and queries, see the following:
11. Repeat the previous steps as required to insert the desired charts, reports, and queries into the grid.
12. Add labels, images, or URLs to the dashboard using the toolbar buttons. The default properties of the label, image, or link display in the properties pane.
13. Edit the properties of the labels, images, or URLs as required. For detailed information on the properties for these components see the following:
14. Edit individual cells in the grid by selecting the cell and editing the properties as required.
15. To preview your changes, click the Preview tab. If any charts or reports are embedded in the dashboard, they run for the preview. Depending on how you designed your dashboard, embedded charts and reports may or may not be filtered by any currently applied dashboard project filter.
16. To save the dashboard layout, click OK on the Edit Dashboard Layout dialog box. The Create Dashboard dialog box displays.
17. To save the dashboard, click OK on the Create Dashboard dialog box.