To run a chart in the Web interface
1. In the Charts View, select the chart you want to run, and select Run Chart. The chart displays in the Chart view.
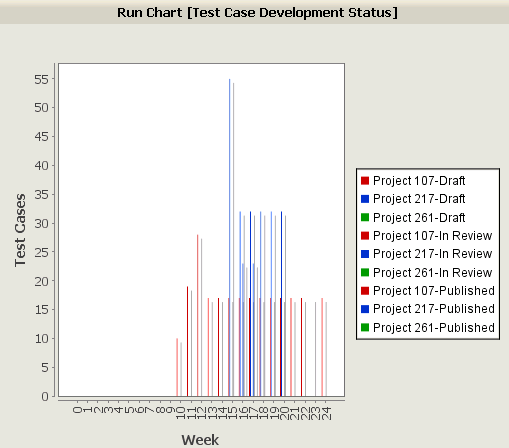
Figure 20. An item fields trend chart using a vertical bar graph style to display development status of all test cases.
2. With the exception of table and pie charts, you can click Zoom Out to zoom out on the axes or Zoom In to zoom in on the axes.
3. To increase the size of the chart, click Increase Size, and to decrease the size of the chart, click Decrease Size.
4. To refresh the contents of the chart, click Refresh View. You can sort a table chart by column or row. Click a column to sort the rows in ascending or descending order for the values in that column; click a row to sort the columns in ascending or descending order for the values in that row.
5. For distribution charts, if you want to view the items that make up a particular chart value, click the chart value (either an area of a bar or pie chart, or a cell in a table chart). The Items view displays only the items that make up that portion of the chart’s data set.
The items are filtered based on the project filter used to produce the chart results. You cannot change the project filter.
For item fields and item fields trend charts, if you want to view a single item that makes up a particular chart value, click the chart value (either an area of a bar or pie chart, a cell in a table chart, or a point on a line graph chart). The ItemDetail view displays detailed information about the item that makes up that portion of the chart’s data set.