To run a chart in the GUI
1. To run a chart, do one of the following:
◦ Select > > , and then specify a selection.
◦ From the Manage Charts view, select a chart, and then one of the following:
▪ >
▪ > >
The chart displays in the Chart view.
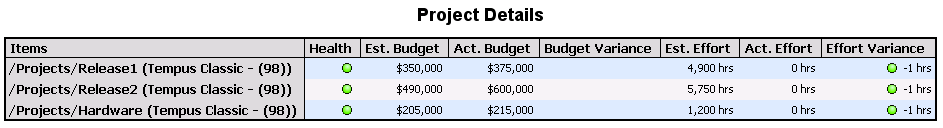
Figure 19. An item fields chart using a table graph style to display Effort, Budget, and Schedule metrics for all active projects.
With the exception of table charts, you can resize all charts by right-clicking and selecting Zoom In or Zoom Out. For bar charts, you also need to select the axis to resize. The axes you can select depend on the graph style of the chart. Select Auto Range to restore the chart to its original size.
You can sort a table chart by column or row. Click a column to sort the rows in ascending or descending order for the values in that column; click a row to sort the columns in ascending or descending order for the values in that row.
2. For distribution charts, if you want to view the items that make up a particular chart value, click the chart value (either an area of a bar, pie, or trend style chart, or a cell in a table style chart). The Items view displays only the items that make up that portion of the chart’s data set.
The items are filtered based on the project filter used to produce the chart results. You cannot change the project filter.
| If you have set up a project filter preference for the Items view, it is disregarded until you run another query. |
With the exception of trend charts, you can view a single item that makes up a particular chart value by clicking the chart value (either an area of a bar, pie, or a cell in a table style chart). The ItemDetail view displays detailed information about the item that makes up that portion of the chart’s data set.