To specify table graph style options
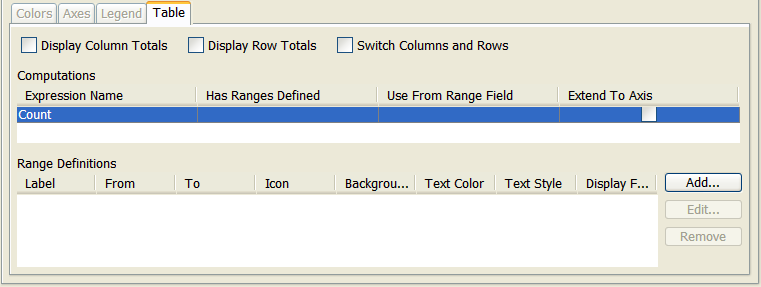
1. If you select the table graph style option in the Graph panel, the Table panel displays.
2. If your chart includes numeric field values and you want to display column totals in the table, select the Display Column Totals option. -Column Totals- displays under the Expression Name column.
If your chart includes numeric field values and you want to display row totals in the table, select the Display Row Totals option. -Row Totals- displays under the Expression Name column.
3. To invert the display of columns and rows in your table, select the Switch Columns and Rows option.
4. If your table chart includes computed expressions, you can define ranges for the resulting numeric values. Computed expressions included in the table chart display in the Computations table. By default, the Count expression displays.
| • You cannot specify a range for the Count expression. • You can specify a range for each computed expression; however, only one computed expression can specify the Extend To Axis option. The Extend To Axis option applies the background color of the selected computed expression to all computed expressions in the table chart. • If a table cell contains a display definition that conflicts with the Extend To Axis option of another table cell, both table cells display the Background Color option of the table cell with the enabled Extend To Axis option. |
5. To define a range for a computed expression, select the computed expression in the Computations table, and click Add. The Add Range Display Definition dialog box displays.
6. Use the Label field to assign a text string to the range category. Range labels can be up to 100 characters long.
7. In the Value field, use the From and To lists to specify values for the lower- and upper-range limits.
| • If a lower limit is not set, -Infinity is automatically entered in the From field. If an upper limit is not set, Infinity is automatically entered in the To field. • A numeric value must be contained in one defined range; range intersections are invalid. For example, the following ranges are invalid: 0 – 5 and 4 – 8, or 0 – 5 and 5 – 10. For an integer field, an acceptable range is 0 – 5 and 6 – 10. For a floating point field, an acceptable range is 0 – 5 and 5.01 – 10. |
8. To assign an icon image to the item, select Use Custom Image, and click Select to browse for the image file. To have no image associated with the type, select No Image. If you specify a custom icon image, the image must be in GIF or JPEG format, and no larger than 24 (width) by 16 (height) pixels.
9. To change the default color used for the Background Color or Text Color, select Custom then click Edit. The Select Color dialog box displays.
10. Select a pre-defined color, or define a custom color for the background color or text color.
11. To change the default text style, select a style from the Text Style list.
12. To change the default display format, select a format from the Display Format list.
13. To save the range display definition, click OK. The Table panel displays the new range display definition in the Range Definitions table.
14. To edit a range for a computed expression, select the computed expression in the Computations table. The range displays in the Range Definitions table.
Click Edit. The Edit Range Display Definition dialog box displays.
To remove a range for a computed expression, select the computed expression in the Computations table. The range displays in the Range Definitions table.
Click Remove. The range is removed from the Range Definitions table.
15. To apply the range definition for a computed expression to all computed expressions in the chart, select a computed expression in the Computations table and enable the Extend To Axis option.
16. To save the table chart, click OK.