To create an item fields trend chart
1. Select one of the following:
◦ >
◦ > >
The Create Chart dialog box displays the General panel.
2. For Chart Type, select Item Fields Trend.
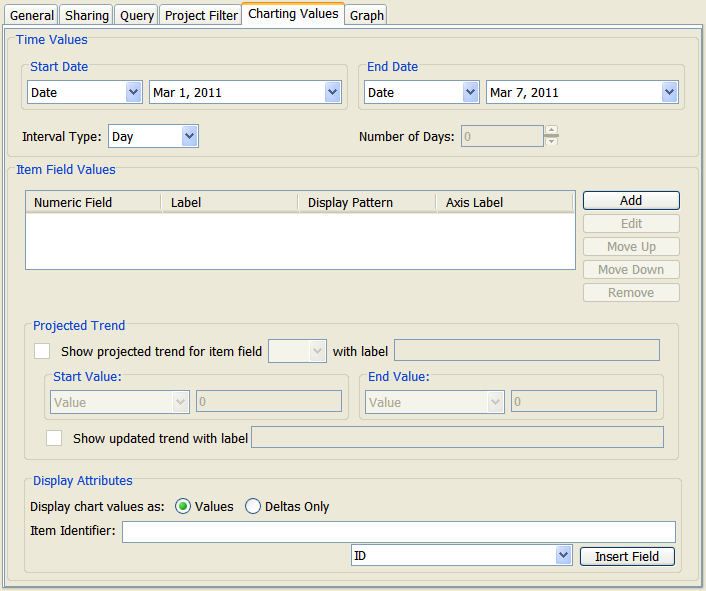
4. Click the Charting Values tab.
Under Time Values, specify a date range for the chart data. Based on the Start Date and End Date values that you select, additional lists and fields become available.
The following table contains possible Start Date and End Date values:
Value | Description |
Date | Specifies an exact date, selected from the calendar field. The default is the current system date. Specifying the date is useful for creating temporary charts with an exact date range. | For the end date, selecting a date in the future uses the run date as the end date. |
|
Item Date Field | Specifies one of the date fields of the item, such asCreated Date (date item created) or Modified Date (date item last modified). |
Calculated Date | Specifies a generic date range that is calculated by an interval type and number of intervals. (See instructions proceeding this table.) Use calculated dates for frequently used charts, such as charting the weekly defect count. You can set the generic date range once, eliminating the need to manually change it each interval. |
Run Chart Date | Specifies the chart’s run date as the end date. This value is available only for End Date. |
The following table contains the valid Start Date and End Date combinations:
Start Date | End Date |
Date | Date |
Date | Calculated Date |
Date | Run Chart Date |
Item Date Field | Calculated Date |
Item Date Field | Item Date Field |
Calculated Date | Date |
Calculated Date | Run Chart Date |
5. For Interval Type , select the interval type to use for summarizing chart data list. Possible values are: Hour, Day, Week, Month, Quarter, and Year. For example, if you select Week, the line graph generated for the chart contains a point on the graph for each week.
When using a calculated date for either the start or end date, you need to specify a value for the interval to generate that calculated date.
6. To specify a value for the interval, enter it in the field to the right. For example, if you specify 5 and the Interval Type is set to Week, a line graph chart displays data during a five-week period.
The chart’s calculated end (or start) date is determined by the product of the interval type and the specified value. For example, setting a start date of 24-Apr-2010 with an interval of 5 weeks, generates an end date of 29-May-2010.
7. To add a numeric field on which to report, click Add. The Add Expression dialog box displays.
If there are multiple numeric fields under Item Field Values, you can change the order of a numeric field by selecting it and clicking Move Up or Move Down.
To remove a numeric field from the chart, select it, and click Remove.
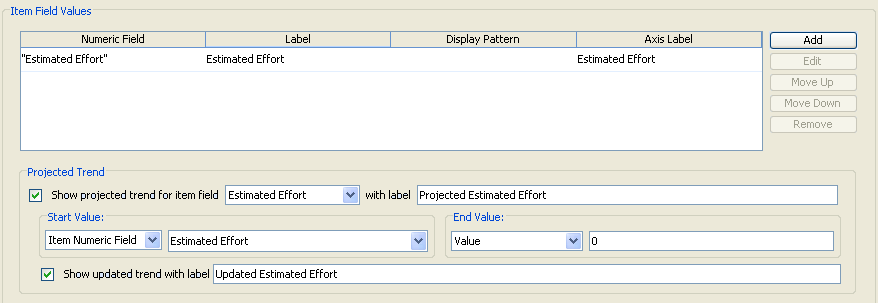
8. You can specify whether to display a projected trend for one of the displayed item field series, thus supporting the use of burn-down charts for planning work remaining within a fixed duration project. The projected trend displays a line between a starting value corresponding to the starting date and the end value corresponding to the end date. In addition, if you choose to display the projected trend, you can also display the actual trend as a line between the last actual series value to the end value corresponding to the end date.
To include a projected trend graph in the chart, in the Projected Trend section, enable Show projected trend for item field and select a value from the list (populated by item field values added in the previous step). Optionally, specify a label in the with label field. Next, specify a Start Value and End Value.
To display the projected trend, enable Show updated trend with label. Optionally, specify a label in the field to the right.
For example:
9. In the Display Attributes section, select from the following:
◦ For Display chart values as:
▪ Select Values if you want to display the current and previous values of the reported numeric fields.
▪ Select Deltas Only if you want to display the differences between the current and previous values of the reported numeric fields. Only item deltas between the chart start and end date are included in the chart.
◦ For Item Identifier, specify the field by which you want to identify items in the chart. For example, if you type {ID}, each item in the chart is identified by the value of the ID field. An item identifier displays as an axis label in the chart. For better visibility, keep item identifiers short. You can manually insert fields into the Item Identifier field by selecting a field from the field list and then clicking Insert Field.
If you want to add text that precedes the field, type it before the field. For example, type Project: {ID}. The chart then identifies each item by displaying Project:ID field value. You can specify multiple fields. For example, type Project: {ID} {State} {Priority}.
11. To finish and save your chart, click OK.