Working in VisualVM
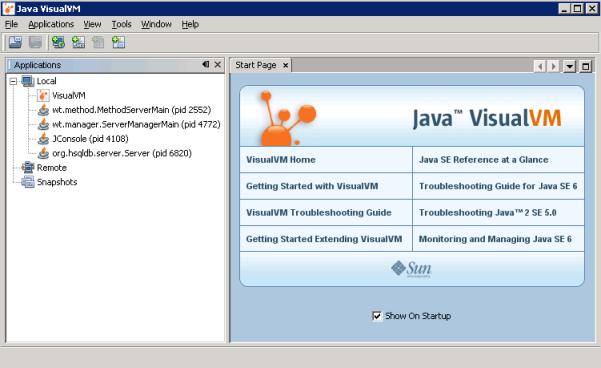
After you start VisualVM, you can see the tree of Java processes that are running locally under the current user ID and that are configured to allow JMX connections. The window presented is similar to the following:
Each node displayed in the tree indicates the process ID and the main Java class that is being run. In this example, the server manager and method server are easily identifiable by their class names.
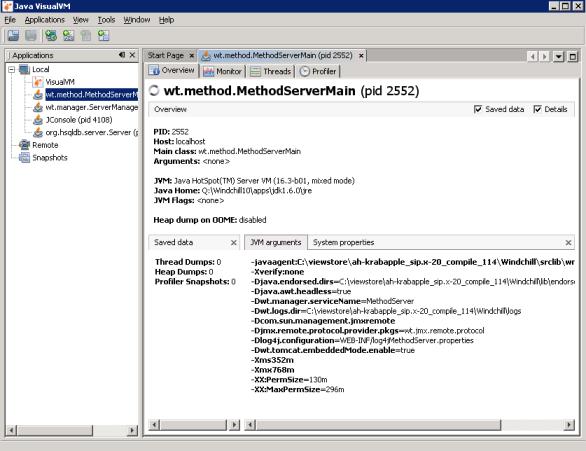
Select one or more of the process nodes and then select Open from the Applications menu. If you select the main method server class, a display similar to the following opens:
The main window provides the following tabs:
• Overview – provides details on data that has been saved, JVM arguments, and system properties. From this tab, you can view the parameters that are being used in the JVM.
• Monitor – Graphs heap and perm gen memory usage, loaded classes, and thread counts over time. Displays the JVM uptime (how long it has been running). Allows a GC (garbage collection) to be requested. Allows a heap dump to be produced, which VisualVM can then open and examine in detail.
• Threads – Graphs the state of all threads in the JVM with respect to time and allows you to examine this data on a per thread basis. Also allows you to produce and view a thread dump.
• Profiler – Allows you to start and stop CPU and memory usage profiling, examine the resulting data, and so on.
• MBeans – provides the interface from which you can do activities such as set logging options, properties, and email options, and monitor JVM activities. This tab is not present until you install the VisualVM-MBeans plugin. See
Installing VisualVM Plugins.
• JConsole Plugins – lists the plugins you have installed. This tab is not present until you install the VisualVM-JConsole plugin. See
Installing VisualVM Plugins.
After you have mastered the basic navigation techniques for VisualVM, you can easily adapt the JConsole examples provided later in this chapter to learn about how to perform some basic Windchill-specific tasks from VisualVM since the MBeans tabs in VisualVM and JConsole are very similar.
| Out-of-the-box, Windchill only allows local JMX connections, essentially those belonging to the same user ID and user account. |
To allow VisualVM (and other JMX management consoles) to connect remotely, additional configuration is required. For information on remote management, see
Remote JMX Monitoring.