JConsole
JConsole uses a tree to display the MBeans, allowing you to easily navigate to the MBean of interest. JConsole is bundled with the JDK.
JConsole is a good JMX management console; however, it is an RMI-based Java application, which is not the best client for all use cases. Also, the JConsole current functionality is not as robust as other JMX consoles. For example, you cannot see a long description of an attribute in JConsole.
Getting Started with JConsole
You can access JConsole from the bin directory of the JDK:
• On a Windows system, start JConsole by double clicking jconsole.exe.
You can also select JConsole from the Start menu (if Windchill shortcuts are installed).
• On other platforms, start JConsole by invoking the jconsole script.
For detailed instructions on using JConsole to manage and monitor applications, use the following URL:
Working in JConsole
After you start JConsole, you can see the list of Java processes that are running locally under the current user ID and that are configured to allow JMX connections. The window presented is similar to the following:

Each line displayed in the table indicates the process ID and the main Java class that is being run. In this example, the server manager and method server are easily identifiable by their class names. The Tomcat process is now listed under individual method servers (as Tomcat is embedded in each method server). For Tomcat process details, see the Catalina node under the method server.
Select the process you want to manage and then click Connect.
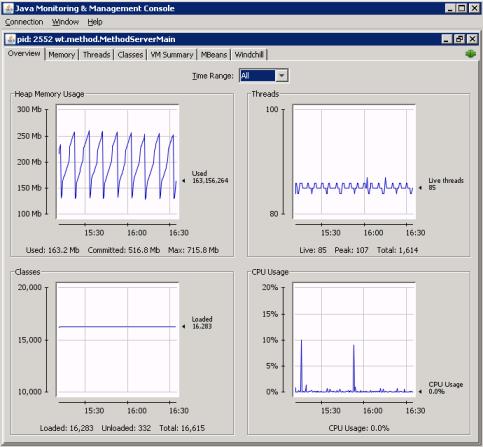
When connecting to a Windchill method server, a display similar to the following opens:

The main window provides the following tabs:
• Overview – provides details on heap memory usage, threads, classes, and CPU usage.
• Memory – provides details on how memory is being used.
• Threads – lists all the threads in the JVM.
• Classes – shows the number of classes unloaded and loaded.
• MBeans – provides the interface from which you can do activities such as set logging options, properties, and email options, and monitor JVM activities.
• VM Summary – gives all detail on Java parameters, operating system data, and so on. From this tab, you can verify that any parameters you specified through the xconfmanager utility were correctly applied and that the machine is not running out of memory.
• Windchill – displays information about the servlet requests and method contexts for the method server. See the section Windchill Tab Information.
After you have mastered the basic navigation techniques for JConsole, you can use the examples provided later in this chapter to learn about how to perform some basic Windchill-specific tasks from JConsole.
Out-of-the-box, Windchill only allows local JMX connections, essentially those belonging to the same user ID and user account. |
To allow JConsole (and other JMX management consoles) to connect remotely, additional configuration is required. For information on remote management, see Remote JMX Monitoring.
Connecting to JConsole
Use the wt.util.jmx.SMJconsole command line utility to connect to JConsole. The utility directly connects to the server manager using the local JMX connection.
The wt.util.jmx.SMJconsole utility works on any trusted host. That includes running the utility on a platform that does not allow JMX connections using process IDs or that does not publish local JMX connections to JConsole. Additionally, you can use the wt.util.jmx.SMJconsole utility when the target process is being run as a different user. However, intervening firewalls can prevent this utility from working.
The wt.util.jmx.SEJconsole utility provides the WtJmxPlugin.jar file, which is a plugin that adds the Windchill tab to the user interface. Starting JConsole from the JConsole shortcuts listed in the Windchill shortcuts folder loads the plugin. If you start JConsole using any other method, you must add the following argument to load the plugin:
-pluginpath <Windchill>/codebase/lib/WtJmxPlugin.jar
where <Windchill> is the Windchill installation directory.
If you are using JConsole remotely, you can download the WtJmxPlugin.jar file from your Windchill server to the remote server and then specify the file that is on your local server.
Windchill Tab Information
When the target JVM is a Windchill method server or server manager, the Windchill tab that is available from the WtJmxPlugin.jar file displays tables of information that is can be helpful when reviewing system operations. The information shown includes the following:
• When connecting to a method server, the servlet requests and method contexts for that method server are shown.
• When connecting to a secondary server manager, those servlet requests and method contexts for that server manager's method servers are shown.
• When connecting to the main server manager, the servlet requests and method contexts for the entire cluster are shown.