Line-Graph
DESCRIPTION
Takes as input an Info*Engine group containing numeric data to be graphed and produces a JPEG image as output.
SYNTAX
<ie:webject name="Line-Graph" type="IMG">
<ie:param name="BACKDROP_COLOR " data="html_color"/>
<ie:param name="BACKGROUND_COLOR " data="html_color"/>
<ie:param name="COLOR " data="html_color"/>
<ie:param name="DECIMAL_PLACES" data="integer"/>
<ie:param name="GRAPH" data="column_name"/>
<ie:param name="GROUP_IN" data="input_groupname"/>
<ie:param name="HEIGHT" data="integer_height"/>
<ie:param name="INSET_BOTTOM" data="integer_inset"/>
<ie:param name="INSET_LEFT" data="integer_inset"/>
<ie:param name="INSET_RIGHT" data="integer_inset"/>
<ie:param name="INSET_TOP" data="integer_inset"/>
<ie:param name="INSETS" data="integer_inset"/>
<ie:param name="MAXY" data="double"/>
<ie:param name="MINY" data="double"/>
<ie:param name="TEXT_COLOR " data="html_color"/>
<ie:param name="WIDTH" data="integer_width"/>
<ie:param name="X" data="column_name"/>
<ie:param name="XSCALE_INCREMENT" data="double"/>
<ie:param name="YSCALE_INCREMENT" data="double"/>
</ie:webject>
PARAMETERS
|
Required
|
Select
|
Optional
|
|---|---|---|
|
GRAPH
|
BACKDROP_COLOR
|
|
|
GROUP_IN
|
BACKGROUND_COLOR
|
|
|
X
|
COLOR
|
|
|
DECIMAL_PLACES
|
||
|
HEIGHT
|
||
|
INSET_BOTTOM
|
||
|
INSET_LEFT
|
||
|
INSET_RIGHT
|
||
|
INSET_TOP
|
||
|
INSETS
|
||
|
MAXY
|
||
|
MINY
|
||
|
TEXT_COLOR
|
||
|
WIDTH
|
||
|
XSCALE_INCREMENT
|
||
|
YSCALE_INCREMENT
|
BACKDROP_COLOR
Specifies the color, in #RRGGBB format, of the backdrop in the generated image. The default value is lightGray (#868686).
BACKGROUND_COLOR
Specifies the color, in #RRGGBB format, of the background of the generated image. The default value is white.
COLOR
Specifies the color, in #RRGGBB format, that the generated bars should be rendered in. This parameter may be multi-valued. If it is multi-valued, then the colors specified are used in order and all values are iterated over until all data in the input group has been graphed. For example, specifying two color parameters as the following:
<ie:param name="COLOR" data="#FF0000,#0000FF" delim=","/>
causes alternating red and blue.
The default value is #0000C8.
DECIMAL_PLACES
Specifies an integer that governs how many decimal places are displayed on scales. This parameter is ignored if no value is given for YSCALE_INCREMENT or XSCALE_INCREMENT. The default value is 0.
GRAPH
Specifies the name of the column(s) containing the data to be graphed. This parameter can be multi-valued
GROUP_IN
Specifies the name of the input group containing data to be graphed.
HEIGHT
Specifies the integer height of the generated image. The default value is 400.
INSET_BOTTOM
Specifies an integer value to use as insets to pad the bottom of the image. The default value is 10.
INSET_LEFT
Specifies an integer value to use as insets to pad the left side of the image. The default value is 10.
INSET_RIGHT
Specifies an integer value to use as insets to pad the right side of the image. The default value is 10.
INSET_TOP
Specifies an integer value to use as insets to pad the top of the image. The default value is 10.
INSETS
Specifies an integer value to use as insets to pad the outside of the image. If this parameter is specified it overrides the presence of INSET_LEFT, INSET_RIGHT, INSET_TOP and INSET_BOTTOM. The default value is 10.
MAXY
Specifies the largest value found in the data set on the Y axis.
MINY
Specifies the smallest value found in the data set on the Y axis.
TEXT_COLOR
Specifies the color, in #RRGGBB format, of text placed in the generated image. The default value is black.
WIDTH
Specifies the integer width of the generated image. The default value is 600.
X
Specifies the name of the column containing the data to be graphed on the X axis.
XSCALE_INCREMENT
Specifies a floating point number governing how to display a scale on the X axis. If specified, scales start at the smallest X value and appear every XSCALE_INCREMENT until the largest X value. The default is to not display a scale on the X axis.
YSCALE_INCREMENT
Specifies a floating point number governing how to display a scale on the Y axis. If specified, scales start at MINY or the smallest value found in the data set and appear every YSCALE_INCREMENT until MAXY or the largest data point found in the data set. The default is to not display a scale on the Y axis.
EXAMPLE
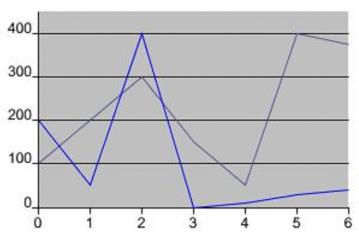
Given the following input data (in GROUP_IN value named “dataSet”):
|
X
|
G1
|
G2
|
|---|---|---|
|
0.0
|
100.0
|
200.0
|
|
1.0
|
200.0
|
50.0
|
|
2.0
|
300.0
|
400.0
|
|
3.0
|
150.0
|
0.0
|
|
4.0
|
50.0
|
10.0
|
|
5.0
|
400.0
|
30.0
|
|
6.0
|
375.0
|
40.0
|
and the following JSP:
<%@page language="java" session="true"
contentType="image/jpeg"
%><%@taglib uri="http://www.ptc.com/infoengine/taglib/core" prefix="ie"
%><ie:webject name="Line-Graph" type="IMG">
<ie:param name="GROUP_IN" data="dataSet"/>
<ie:param name="COLOR" data=" #5B5B97,#0000FF" delim=","/>
<ie:param name="X" data="X"/>
<ie:param name="GRAPH" data="G1,G2" delim=","/>
<ie:param name="WIDTH" data="300"/> <ie:param name="HEIGHT"
data="200"/>
<ie:param name="YSCALE_INCREMENT" data="100"/>
<ie:param name="XSCALE_INCREMENT" data="1"/>
<ie:param name="MINY" data="0"/>
<ie:param name="MAXY" data="450"/>
<ie:param name="INSET_LEFT" data="15"/>
</ie:webject>
Results in the following image:

If titles and a legend are required, they should be generated programatically in the JSP that includes this image.