Confidence Models
Why Use a Confidence Model?
Predictive models generate predictions that are based on probabilities and not certainties. So, predictions are almost never perfect. When designing systems that rely on these predictions, it’s important to keep this uncertainty in mind. If decisions about future actions are made on the basis of these predictions, either by a human user or a machine, the degree of uncertainty in a specific prediction can be critically important.
A confidence model is a way of adding confidence interval information to a predictive model. Statistically, for a given prediction, a confidence model provides an interval with upper and lower bounds, within which it is confident, up to a certain level, that the actual value occurs. During predictive scoring, this measure of confidence provides additional information about the accuracy of the prediction.
Confidence models operate differently depending on the type of data being predicted. The next sections describe how confidence models are applicable when scoring different types of data.
|
|
In ThingWorx Analytics 8.5.x, confidence model functionality is available for continuous and ordinal data only.
|
Confidence Models with Continuous Data
Predictive scoring, on data that can be represented on a continuous scale, returns a single normalized output value, which is then transformed back to the original scale. With a confidence model, predictive scoring on continuous data returns a range of values for each prediction. The confidence model predicts with a specific confidence level that the actual value will occur within that range.
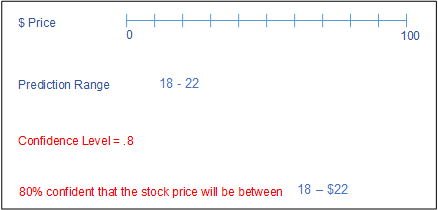
For example, consider a model that is created to predict the value of a stock. Scoring predicts that the stock will be valued at $20 on a given day. Without a confidence level, there is no information available to evaluate the likelihood that the prediction will be correct. A confidence model with a user-defined confidence level can provide additional information. In the image shown below, scoring with a confidence model returned a prediction of the stock’s value between $18 and $22. With a confidence level of .8, the results can be interpreted as follows: the model is 80% confident that the stock’s value will be between $18 and $22 on a specific day.
For more information about interpreting confidence model output for industrial data, see Sample Confidence Model Prediction Results for Continuous Data.

Confidence Models with Ordinal Data
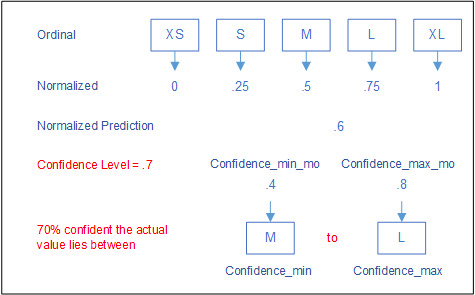
Applying a confidence model to ordinal data returns a complex set of results. It returns confidence minimum and maximum ranges in both normalized values and in the ordinal scale. For example, consider a dataset that includes t-shirt sizes, XS, S, M, L, XL. During model training, these ordinal categories are converted internally to normalized numbers and handled as continuous values. If predictive scoring returns a normalized value of .6, the prediction is converted to M in the ordinal scale because it corresponds most closely to the .6 value.
When you add a confidence model, predictive scoring returns a range of values on the normalized continuous scale. This range is represented by the Confidence Minimum Model Output (Confidence_Min_mo) and the Confidence Maximum Model Output (Confidence_Max_mo) values. These normalized continuous model outputs are then translated into the ordinal scale and returned with the results.
In the image below, the user-defined confidence level is .7. In this case, the predictive scoring returns a value of .6. The confidence model returns a range: confidence_min_mo = .4, confidence_max_mo = .8. These normalized numbers are converted back to the closest ordinal categories in the original scale. In this case .4 is closest to M and .8 is closest to L. The model then generates two additional results: Confidence_Min = M, Confidence_Max = L. These results can be interpreted as follows: the model is 70% confident that the actual size is between M and L.
For more information about interpreting confidence model output for industrial data, see Sample Confidence Model Prediction Results for Ordinal Data

Overview of Confidence Model Generation
When a predictive model is created in ThingWorx Analytics, training data is used to generate the model, and a holdout set of validation data is used to calculate model accuracy and other statistics. If the confidence model functionality is enabled, the validation data is also used to generate a confidence model, based on a user-entered confidence level. For each prediction, the system uses the confidence level to calculate upper and lower bounds that define a range within which the actual value is likely to occur.
In ThingWorx Analytics, one or more confidence models can be generated at the same time that the predictive model is trained. The predictive model is output in a PMML format. The confidence model duplicates the predictive model and attaches its own PMML output to it. When defining confidence levels, remember that the higher the level, the wider the range of possible values is likely to be. If the confidence level is set too high, the confidence model may not be very useful.
How to Access Confidence Model Functionality
In ThingWorx Analytics, confidence model functionality can be accessed via the following methods:
• ThingWorx API – In ThingWorx Composer, confidence models can be generated during new model training or during validation of an existing model. Requires installation of both ThingWorx Foundation and ThingWorx Analytics Server. Available beginning in release 8.5. For more information, see Generating Confidence Models via ThingWorx APIs
Related Links