Create an Excel Workbook
An Excel model is an Excel workbook with special characteristics. The Analytics Manager framework uses the XML maps mechanism in Excel to import data in and export results out of Excel. The following examples provide instructions to create an Excel workbook that can be used with Analytics Manager.
|
|
Before you create the Excel workbook, note the following points:
• Set the results to be automatically calculated for your Excel sheet. To do this, click the Formulas tab and under the Calculation group, click > .
• If your Excel sheet uses external references to load input data into your sheet and it is unable to find those external references, it gives a pop-up alert. It is recommended to disable the alert pop-up option in Excel. To do this, complete the following steps:
1. If your Excel sheet that has external references, click the Data tab and under the Connections group, click Edit links.
2. In the Edit Links window, click Startup Prompt, and select Don’t display the alert and update links.
|
Calculate the average of a number of columns in a table and return a table with a single row that has the average of all the columns
1. Create an Excel sheet to calculate the average of a number of columns in a table and return a table with a single row that has the average of all the columns.
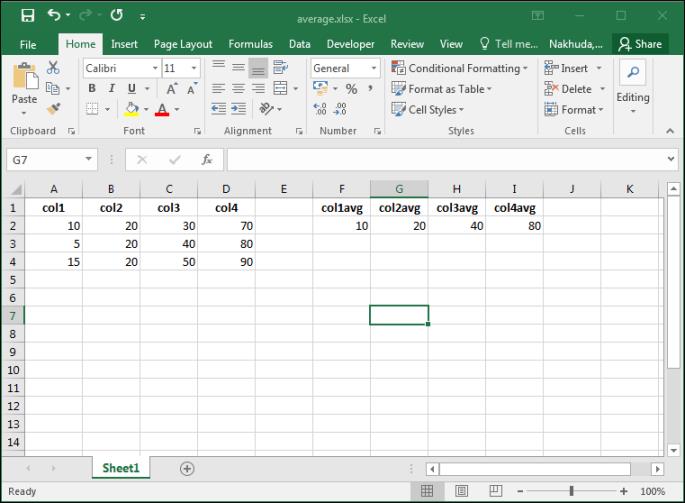
The input values come from the following columns:
◦ col1
◦ col2
◦ col3
◦ col4
Each of these columns can contain any number of numeric values.
The result values come from the following cells:
◦ F2
◦ G2
◦ H2
◦ I2
These cells have formulas to calculate the average value of an input column. =AVERAGE(A:A), =AVERAGE(B:B), =AVERAGE(C:C), =AVERAGE(D:D) respectively.
2. Create XSD files for inputs and results.
The XSD for input values is shown below:
<?xml version="1.0" encoding="utf-8"?>
<xs:schema id="table_of_numbers" attributeFormDefault="unqualified" elementFormDefault="qualified"
xmlns:xs="http://www.w3.org/2001/XMLSchema">
<xs:element name="table_of_numbers">
<xs:complexType>
<xs:sequence>
<xs:element name="row" maxOccurs="unbounded">
<xs:complexType>
<xs:sequence>
<xs:element name="col1" type="xs:integer" minOccurs="1" maxOccurs="1"></xs:element>
<xs:element name="col2" type="xs:integer" minOccurs="1" maxOccurs="1"></xs:element>
<xs:element name="col3" type="xs:integer" minOccurs="1" maxOccurs="1"></xs:element>
<xs:element name="col4" type="xs:integer" minOccurs="1" maxOccurs="1"></xs:element>
</xs:sequence>
</xs:complexType>
</xs:element>
</xs:sequence>
</xs:complexType>
</xs:element>
</xs:schema>
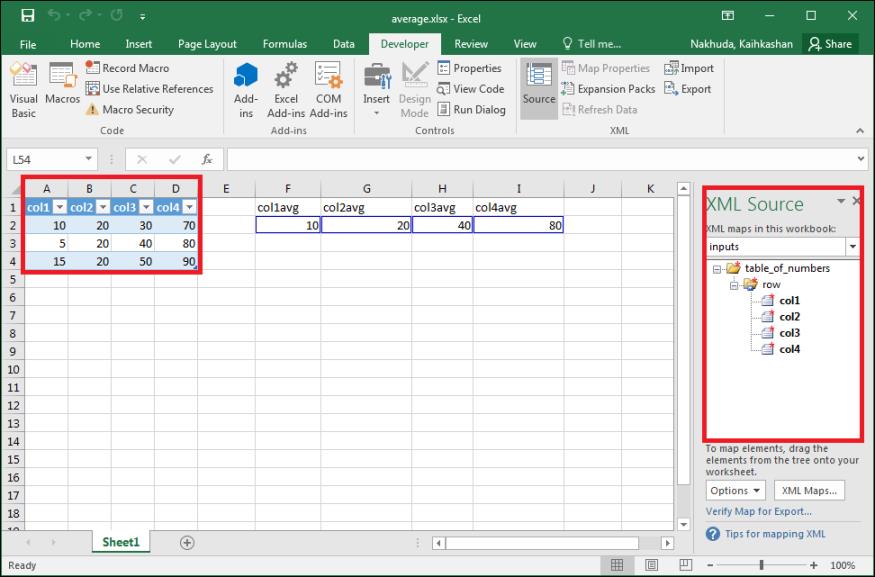
This XSD is imported into the Excel workbook and mapped to the corresponding input columns (A,B,C,D respectively with the heading on row 1).
The XSD for result values is shown below:
<?xml version="1.0" encoding="utf-8"?>
<xs:schema id="resultsTable" attributeFormDefault="unqualified" elementFormDefault="qualified"
xmlns:xs="http://www.w3.org/2001/XMLSchema">
<xs:element name="resultsTable">
<xs:complexType>
<xs:sequence>
<xs:element name="col1avg" type="xs:decimal" maxOccurs="1"></xs:element>
<xs:element name="col2avg" type="xs:decimal" maxOccurs="1"></xs:element>
<xs:element name="col3avg" type="xs:decimal" maxOccurs="1"></xs:element>
<xs:element name="col4avg" type="xs:decimal" maxOccurs="1"></xs:element>
</xs:sequence >
</xs:complexType>
</xs:element>
</xs:schema>
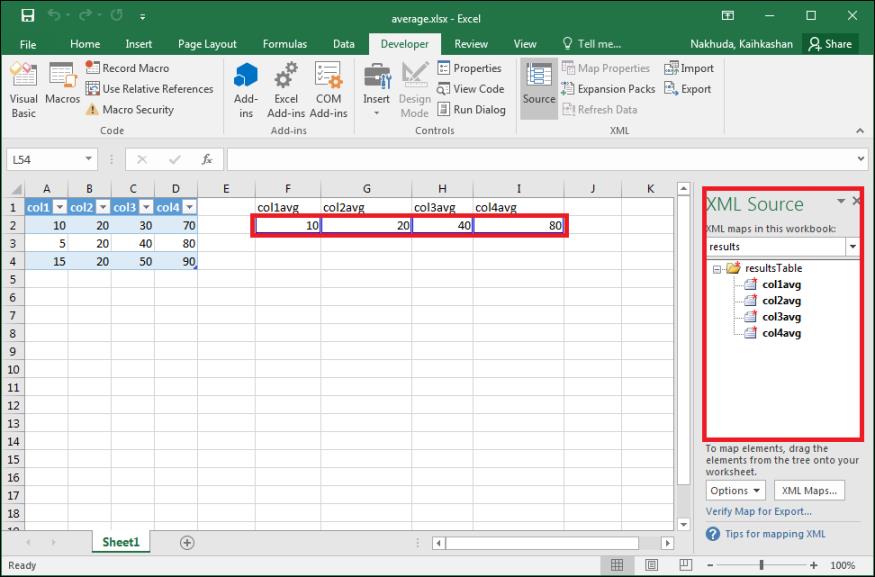
This XSD is imported into the Excel workbook and mapped to the F2, G2, H2, and, I2.
3. Create two XML maps in Excel, one for inputs and the other for results.
Ensure that the XML maps that you create are named inputs and results. |
The XML maps are used to provide input values and retrieve results from the workbook. Additionally, the XML maps are used during model creation to build the required ThingWorx data shapes for the analysis model. While creating the XML files, note the following points:
• The name of the top element in the XML schema must match with the schema ID. • Define types in XML schema to enable reuse of element definitions. You can do this by naming simpleTypes and complexTypes, and using them through the type attribute of an element. |
For information about XML maps, see this.
4. Map the XML elements to the corresponding cells in Excel. Ensure that you map each input and output cell.
The following image shows the input XML map and the mapped elements:
The following image shows the result XML map and the mapped elements:
For information about mapping XML elements to cells in Excel, see Map XML elements.
Calculate an alert after comparing values of multiple properties
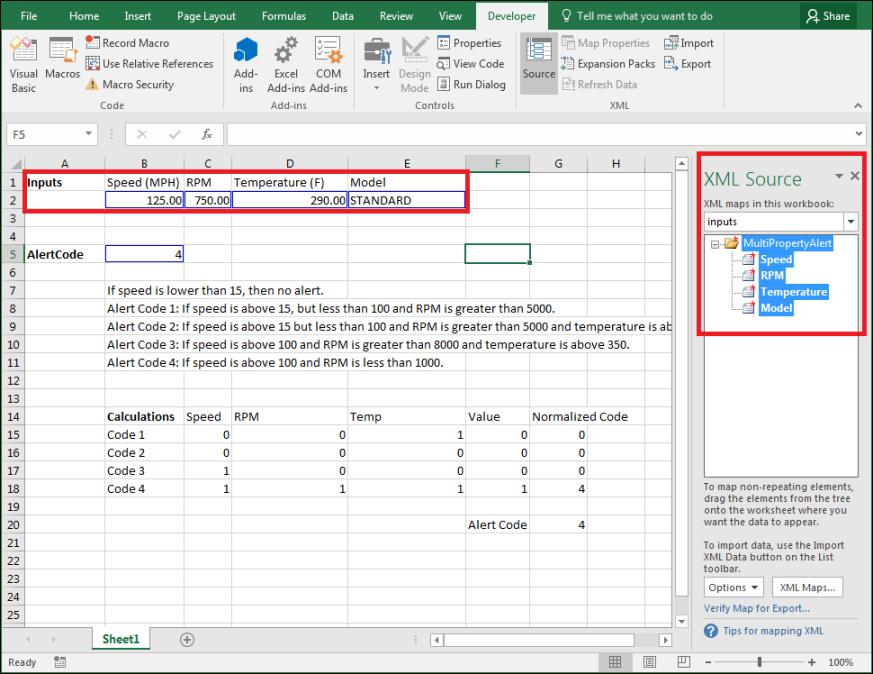
1. Create an Excel sheet to compare the input values (Speed, RPM, and Temperature), and depending on the alert code conditions, return an appropriate alert code.
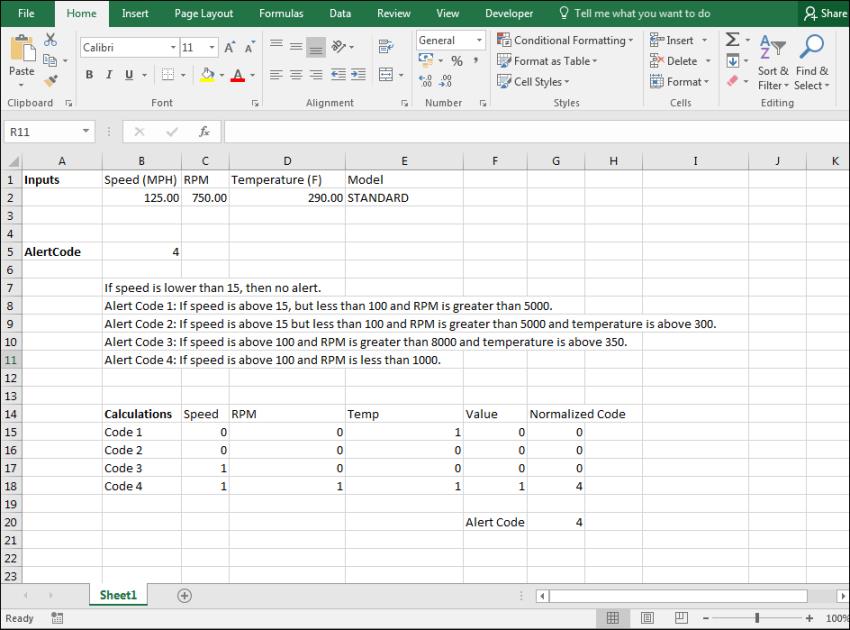
The input values come from the B2, C2, and D2 cells. The alert code result value comes from the B5 cell.
The alert code conditions are shown in the figure above.
2. Create XSD files for inputs and results.
The XSD for input values is shown below:
<?xml version="1.0" encoding="utf-8"?>
<xs:schema id="MultiPropertyAlert" attributeFormDefault="unqualified" elementFormDefault="qualified"
xmlns:xs="http://www.w3.org/2001/XMLSchema">
<xs:element name="MultiPropertyAlert">
<xs:complexType>
<xs:sequence>
<xs:element name="Speed" type="xs:decimal" maxOccurs="1"></xs:element>
<xs:element name="RPM" type="xs:decimal" maxOccurs="1"></xs:element>
<xs:element name="Temperature" type="xs:decimal" maxOccurs="1"></xs:element>
<xs:element name="Model" type="xs:string" maxOccurs="1"></xs:element>
</xs:sequence>
</xs:complexType>
</xs:element>
</xs:schema>
This XSD is imported into the Excel workbook and mapped to the corresponding input cells.
The XSD for result values is shown below:
<?xml version="1.0" encoding="utf-8"?>
<xs:schema id="MultiPropertyAlertResults" attributeFormDefault="unqualified" elementFormDefault="qualified"
xmlns:xs="http://www.w3.org/2001/XMLSchema">
<xs:element name="MultiPropertyAlertResults">
<xs:complexType>
<xs:sequence>
<xs:element name="AlertCode" type="xs:decimal" maxOccurs="1" minOccurs="1"></xs:element>
</xs:sequence >
</xs:complexType>
</xs:element>
</xs:schema>
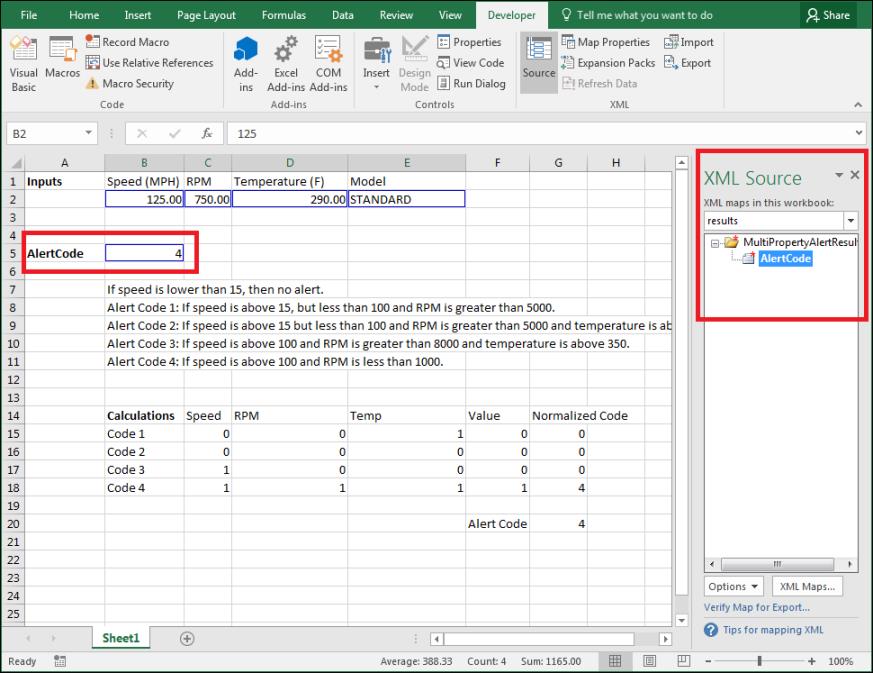
This XSD is imported into the Excel workbook and mapped to the corresponding result cell.
3. Create two XML maps in Excel, one for inputs and the other for results.
Ensure that the XML maps that you create are named inputs and results. |
The XML maps are used to provide input values and retrieve results from the workbook. Additionally, the XML maps are used during model creation to build the required ThingWorx data shapes for the analysis model. While creating the XML files, note the following points:
• The name of the top element in the XML schema must match with the schema ID. • Define types in XML schema to enable reuse of element definitions. You can do this by naming simpleTypes and complexTypes, and using them through the type attribute of an element. |
For information about XML maps, see this.
4. Map the XML elements to the corresponding cells in Excel. Ensure that you map each input and output cell.
The following image shows the input XML map and the mapped elements:
The following image shows the result XML map and the mapped elements:
For information about mapping XML elements to cells in Excel, see Map XML elements.
Verification
Use the VerifyModel.exe tool to determine if the Excel worksheet meets the requirements of the Analytics Manager framework. You can run the tool using the command-line interface as well. The syntax of the tool is as follows:
VerifyModel -d <model_file_name>
If all checks pass, the utility provides a confirmation message and you can deploy the model in the Analytics Manager framework. If you receive an error message, ensure that you correct the issues in the workbook before you deploy the model.