Viewing Events
General
Events are shown in the top event timeline area of the chart. Event timelines are shown in the same order as they are in the legend.
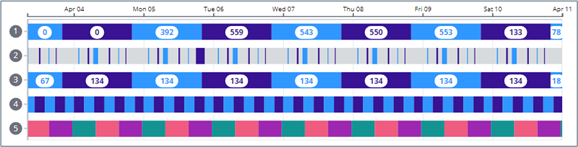
Each color band represents an aggregated time range or an event duration. For most event types, colors alternate between blue and purple to clearly indicate where one event ends and another begins. See the Alarm section below for more information on alarm event colors and duration. See the Shifts Section below for more information on shift event colors.
Where there are no events, the timeline is shown in light gray.
Double clicking an event or event group will zoom the entire chart x-axis to the event time span.
Aggregated Event Data
When the event timeline has a lot of events over a long time frame, the chart will automatically aggregate the events into groups based on time.

The number label over each group indicates the number of events contained within the group. A tooltip over the group will also show the event count. Double-clicking on a group will zoom to the scope of that group and show the aggregated events individually.
Actual Event Data
When fewer events exist within the time frame, or if the chart is zoomed, actual event durations will be shown. Because the events are not grouped. The event count label will not beshown.

Event Tooltips
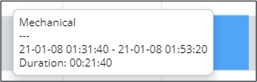
When viewing actual event timeline data, a tooltip will show detailed information for an event on mouse over. The information shown will vary based on the event type.
• Alarm – Alarm name, severity level, start time and end time, duration, status, ‘acknowledged by’ username, acknowledged time, and names of concurrent alarms.
• Downtime – Reason, reason category, start time and end time, and duration.
• Product Change – Product name, start and end time, and duration.
• Production – Work order, product name, product status, start and end time, duration, quantity and unit of measure.
• Shift Change – Shift name, crew name, start and end time, and duration.
• Waste – Reason, reason category, start time and end time, duration, quantity and unit of measure.
• Work Order Change – Work order, product name, start and end time, and duration
Alarms
When alarm events are not aggregated, they are colorized according to alarm severity.
• Red — High severity
• Amber — Medium severity
• Dark Gray — High severity

An equipment may have more than one alarm open at a time. In this case, the highest severity alarm will be shown in the event timeline. The tooltip for alarms displays will display any concurrent alarms.
If two alarms concurrently have the highest severity, the alarm that was created first will take precedent. |
Shifts
When shift events are not aggregated, they are colored according to shift name. Up to 14 shift event colors are supported.
