Legend Panel
General
The right legend panel shows all selected data sources. It is split into two distinct sections, the Event Timeline and the Trends panel.
The action toolbar actions are available once items are added to the panel and an item is selected.
Saving and Loading Preferences
While using Process Troubleshooter, data sources and legend preferences can be saved, allowing the user to continue analyzing data later without reconfiguring data sources.
Hover over the three dots to the top right to access the legend submenu. Three options will display.
• Save Preferences — Saves the current data sources and preferences. Disabled if the legend panel is empty
• Load Preferences — Loads the most recently saved data sources and preferences. Disabled if there are no currently saved preferences.
• Reset All — Removes all data sources and preferences from the legend panel.
Chart View vs Data Source View
The left two panels can be swapped between the chart viwe and the data source view. When looking at the data source view, click  in the top of the right panel. When looking at chart view, click
  ocated in the same spot.
Y Axis Modes
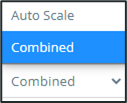
The chart’s y-axis mode can be set to either Combined or Auto Scale by clicking the dropdown in the footer of the legend.
Combined mode takes the trend data overall minimum and maximum to set the y-axis range. The chart’s y-axis labelling is always shown in gray.
Auto Scale mode will render trends to always take up the available room on the chart. The y-axis labelling is hidden until you select a single trend. When shown, the y-axis labelling will be specific to the selected trend and will use the same color.