Alarm Report
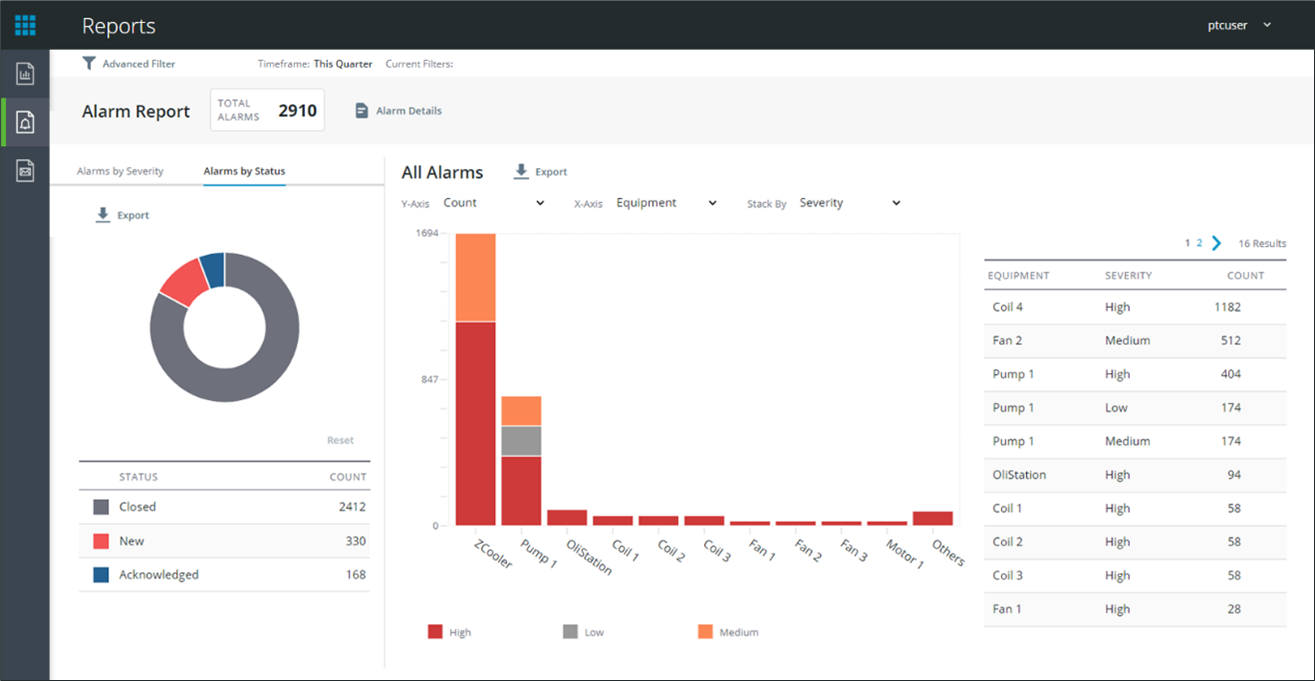
The Alarm Report shows an overview of alarm events grouped by equipment, severity, and status. Users can drilldown to spot equipment of concern, helping them to identify priorities for asset reliability initiatives.
When first accessing the Alarm Report, a time frame must be selected from the Advanced Filter panel.One or more pieces of equipment can be selected on which to filter. If nothing is selected in the equipment section, data for all equipment will be returned.
The top of the Alarm Report shows a total alarms count based on the filter and includes the Alarm Details button.
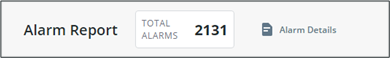
Click Alarm Details todisplay apopupwithall alarm events. From the popup, click Export to download the raw data as a .csv.
The left pane shows donut chartsof thealarm count groupedintabs forseverityandstatus. Click Export to download the raw datainthe chart as a .csv.
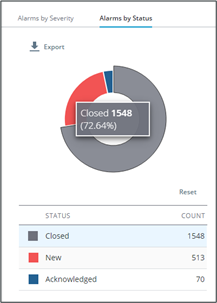
Click a slice of the donut chart, or the item in the legend below to drilldown the bar chart shown on the right. Click Reset above the legend to deselect and reset the right bar chart toanoverview of all alarms.
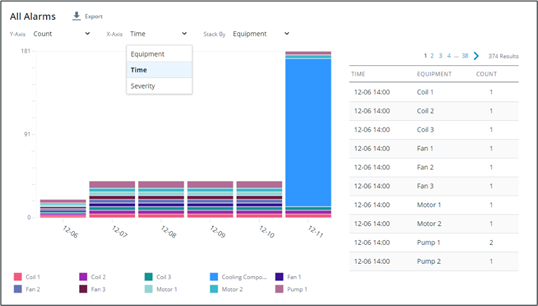
The right bar chart and grid show details from the left donut chart. Dropdown controls allows the fine-tuning of the chart display to select y-axis, x-axis, and stack-by options.
When Alarms by Severity is the active tab in the left pane, the bar chart y-axis options include alarm count, average acknowledgement time, and average close time. The x-axis options include equipment, time, and status.
When Alarms by Status is the active tab in the left pane, the bar chart y-axisis thealarm count. The x-axis options include equipment, time, and severity.
The bar chart data can be stacked by severity or status with equipment selected for the x-axis or by equipment with time, status, or severity selected for the x-axis.
The grid to the right side of the bar chart shows the non-aggregated data for the chart. Click Export next to the bar chart title to download the raw data in the chart as a CSV file.