Monitoring Menu
The Monitoring menu is only visible to users with administrator permissions. It provides details about what is happening in ThingWorx.
Logs
The logs record information on what is running and what is happening, particularly errors. A recording level can be set for each log using the Configure setting. Depending on the log level, you will receive more or less granularity of what is going on in the system. The logs are kept in separate files on the server in /ThingworxStorage/logs.
|
|
Monitor your log sizes and purge them consistently, by backing up the files first or by discarding them. Each of these logs can be filtered using the date range filter and can be limited to a number of rows. The content that is logged is governed by the settings configured in the system property editor.
|
• Application: The Application Log contains all the messages that ThingWorx logs while operating. Depending on your settings, this can display errors only or errors for each individual execution that the platform performs.
• Communication: The Communication Log contains all communication activity with ThingWorx.
• Configuration: The Configuration Log contains all the messages that ThingWorx generates about any create, modify, and delete function performed in ThingWorx.
• Database: The Database Log contains database activity.
• Security: The Security Log contains all the messages that ThingWorx generates regarding users (for example, logins and page requests).
• Script: The Script Log contains all the messages that ThingWorx generates while executing JavaScript services. You can use the logger.warn (or info, trace, debug, error) function to log information to this script log from the services you are running. Generally, ThingWorx will only publish errors to this log incurred while running a service.
Status
The Status menu allows you to monitor the following:
• Active Edits: displays active edits and details by all users. Includes entity name and type, user name, and time of edit.
• Connection Servers: monitor the connection details and status of all connection servers.
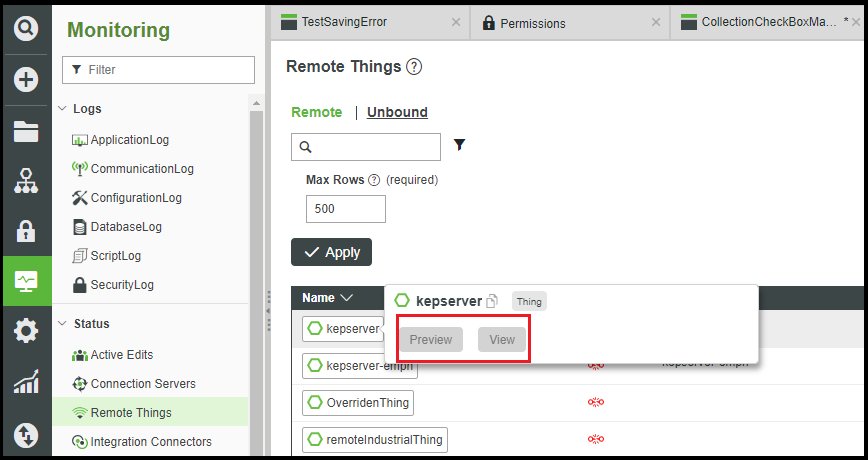
• Remote Things: monitor the details and connection status and of all remote things.
|
|
If a Remote Thing on the Monitoring page has grayed out buttons, it denotes that it is an ephemeral thing or you do not have read access to the Thing. These ephemeral Things are not persisted to the database and only live in-memory for the life of the remote connection or until the server is restarted.
|

• Integration Connectors: monitor the connection status of all integration connectors.
• Subsystems: monitor and control the status and details of all subsystems.
• System Statistics: monitor the event queue size, memory in use, user count, stream queue size, system run time, system start time, schema version, software version, value stream queue size, and total memory allotted.
System run time and System start time indicate the Platform Subsystem run time and start time. |
• Connected Users: monitor the names, connection status, and details of the current users. The following actions can be taken for any connected user:
◦ Terminate Session: causes the user to be logged out immediately, but they will be able to log back in.
◦ Disable User: does not disrupt the user's current session, but they will be unable to log back in after logout.
Alerts
Alert History and Alert Summary streams provide the functionality to monitor alerts in the system.
• Alert Summary: compiles data from the last reset of the server to the current state. Within the Alert Summary page, alerts can be viewed, acknowledged, and sorted (by acknowledged or unacknowledged).
• Alert History: a comprehensive log that records all information recorded into the alert stream, and the data is stored until manually removed.