Using the Bar Chart in Runtime
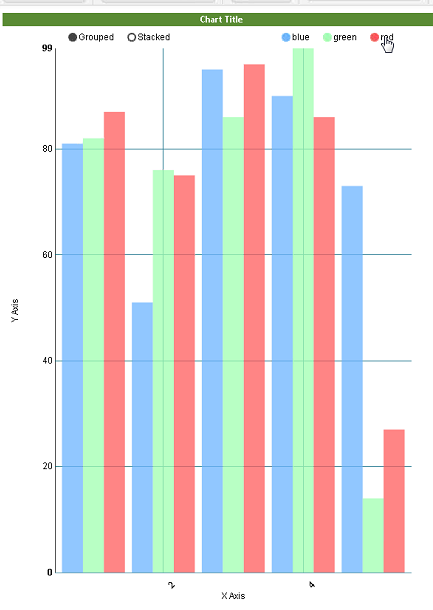
The bar chart is responsive in run time. The legend can be used to view the data in different ways. The example bar chart below contains three data series. Note the following run time behaviors:
• To turn a data series on or off, click the series name in the legend
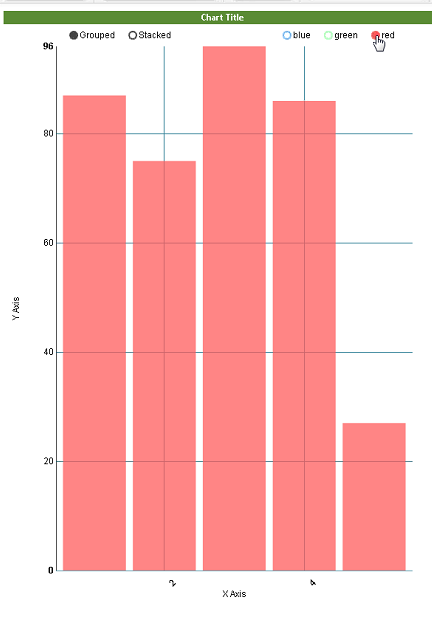
• To view a single data series, double-click it in the legend
 |
 |
Grouped Vs Stacked View
If you have more than one data series, you can change the display of the data in the chart in run time by clicking the Grouped and Stacked legend options.
|
Stacked 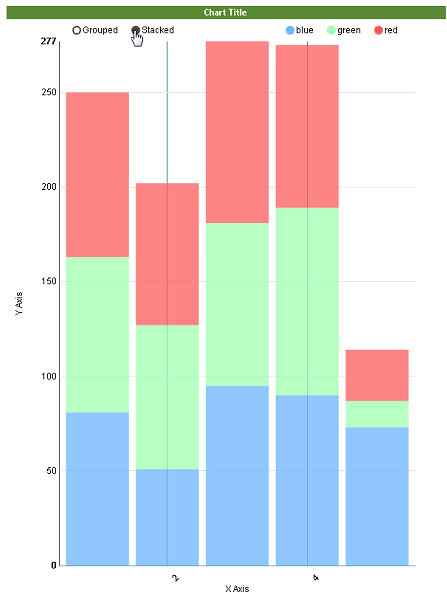 |
Grouped 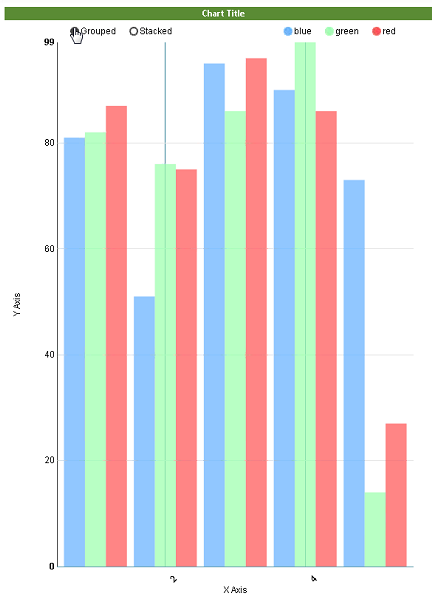 |