JavaScript Debugger
Overview
The JavaScript Debugger helps you to test Thing services and identify and fix errors in the code. You can define breakpoints on lines in the code where you want the debugger to pause during execution. At a defined breakpoint, you can examine the code using the debugger toolbar and modify the values of variables.
|
|
The JavaScript Debugger does not work with SQL functions.
|
|
|
We recommend that you disable the JavaScript Debugger in production environments. In the JavaScript Debugger, the JavaScript is optimized for reduced runtime and compiled with the debugging information, which can impact system performance. To avoid performance degradation in your production environment, only use the JavaScript Debugger in development and test environments.
|
Script Editor
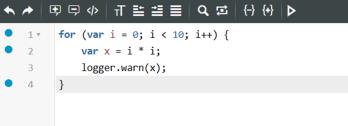
Debugging takes place in the script editor pane of the JavaScript Debugger. You can inspect the code and edit it here.
The image below shows the script editor in edit mode:
You can click  on the script editor toolbar to start debugging. When debugging starts, the script editor toolbar changes to the debugger toolbar. For more information, see Debugger Toolbar. When the debugger is running, the script editor is in read-only mode; therefore, you cannot edit the code.
on the script editor toolbar to start debugging. When debugging starts, the script editor toolbar changes to the debugger toolbar. For more information, see Debugger Toolbar. When the debugger is running, the script editor is in read-only mode; therefore, you cannot edit the code.When the script editor is in debug mode, the following occurs:
• The background color of the script editor appears light gray.
• A red border appears around the script editor.
• A header appears in the script editor and contains the following:
◦ Debugging label, which helps you to quickly differentiate between edit and debug modes.
◦ Entity of the code being debugged. This entity could be different than the entity that was originally selected in the script editor.
◦ Service name of the code being debugged.
◦ Stop Debugging button, which allows you to stop the debugger.
Script Tools
Script tools allow you to manage the debugging process, make changes to the variables, and edit the code while in debug mode.
The script tools consist of the following tabs:
• Execute— Allows you to enter values into fields and execute the service. After execution, the output is displayed in this tab.
• Reference— Allows you to view a second service while debugging a service.
• Debug— Allows you to debug a service.
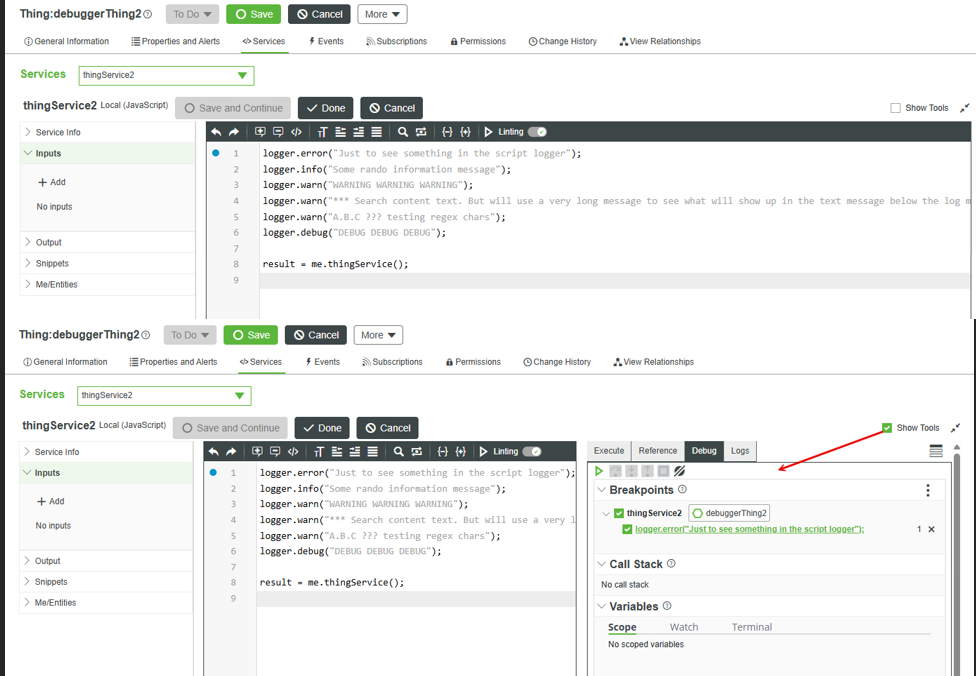
The Debug tab consists of the following:
• Logs— Allows you to view the script log messages for the current service.
The default orientation of the script tools pane is horizontal. However, the Debug tab is designed to optimize the vertical space; therefore, we recommend that you use the vertical orientation. To change the orientation, click  below the script editor.
below the script editor.When maximized, the script tools pane displays the Show Tools checkbox. If selected, it displays the debugger toolbar in the Debug tab. This allows you to use the debugger toolbar to set values for variables and check conditions in the code during runtime.
Permissions
By default, the JavaScript Debugger is available to the following user groups:
• Administrators
Administrators can provide access permissions to users.
• Developers
To debug a direct or nested service, you must have the following permissions on the Thing where the service is defined:
• Visibility
• Design time
• Run time
If you have runtime permission to execute a nested service call but do not have design-time permission to view a particular service, the JavaScript Debugger does not debug that service. If you try to step into that service, the JavaScript Debugger moves to the next service in the call stack for which you have the required permissions. Skipped services are displayed in the call stack, but you cannot access their source code in the script editor or view related variables in the Scope tab. This behavior ensures that logic and sensitive data are protected.