JavaScript Debugger
|
|
The JavaScript Debugger (beta) is currently available in preview mode only and is not a verified feature in ThingWorx Platform 10.0.x releases.
|
|
|
Enabling the Enable Beta Mashup Features setting to use the JavaScript Debugger (beta) disables legacy mashup positioning and forces flex‑based layouts. Do not enable this feature in production environments. For more information, see Platform Subsystem.
|
Overview
The JavaScript Debugger will help you to test Thing services, identify errors in the code and fix them. You can define breakpoints at various lines in the code where you want the debugger to pause during execution. The debugger stops on the line at which the breakpoint is set. At that point, you can examine the code using the debugger toolbar and modify the values of variables.
The JavaScript Debugger does not work with SQL functions.
Script Editor
Debugging takes place in the script editor pane of the JavaScript Debugger. You can inspect the code and edit it here.
The image below shows the script editor in edit mode.
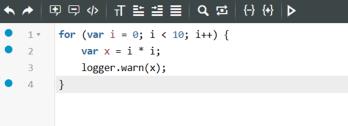
You can click  on the script editor toolbar to start debugging. When debugging starts, the script editor toolbar changes to the debugger toolbar. For more information, see Debugger Toolbar. When the debugger is running, the script editor is in read-only mode, so you cannot edit the code.
on the script editor toolbar to start debugging. When debugging starts, the script editor toolbar changes to the debugger toolbar. For more information, see Debugger Toolbar. When the debugger is running, the script editor is in read-only mode, so you cannot edit the code.When the script editor is debug mode, the following occurs:
• The background color of the script editor appears light gray.
• A red border appears around the script editor.
• A header appears in the script editor and contains the following:
◦ Debugging label, which helps you to quickly differentiate between edit and debug modes.
◦ Entity of the code being debugged. This entity could be different from the entity originally selected.
◦ Service name of the code being debugged.
◦ Stop debugging button, which allows you to stop the debugger.
Script Tools
Script tools allow you to manage the debugging process, make changes to the variables, and edit the code while in debug mode.
The script tools consist of the following tabs:
• Execute— Allows you to input values into fields and execute the service. After execution, the output is displayed in this tab.
• Reference— Allows you to view another service while debugging. It provides a parallel view of two different services.
• Debug— Allows you to debug a service.
The Debug tab consists of the following:
• Logs— Allows you to view the script log messages for the current service.
The default orientation of the script tools pane is horizontal. However, the Debug tab is designed to optimize the vertical space; therefore, we recommend that you use the vertical orientation. To change the orientation, click  below the script editor.
below the script editor.When maximized, the script tools pane displays the Show Tools checkbox. If selected, it displays the debugger toolbar in the Debug tab. This allows you to use the debugger toolbar to set values for variables and check conditions in the code during runtime.
