Trending and Troubleshooting

From the Trending and Troubleshooting page, you can create trends to visualize data for rapid troubleshooting. Use this page to track trends that use tags or properties for a given piece of equipment.
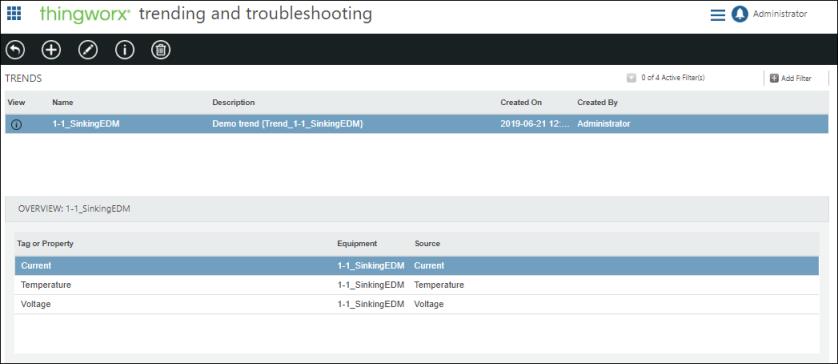
Select a trend in the Trends list to see an overview of the tags and properties included in that trend.
Click  to view details of the selected trend. View selected tags or properties on the trend over varying lengths of time by choosing one of the preset timeframes, or by defining a custom timeframe. On the graph, click and drag vertically or horizontally to zoom in and double-click to zoom out. The selection for each property or tag under the left-or-right axis icon (
 ) determines whether its values and value range are displayed on the left Y-axis or the right Y-axis of the chart. This allows you to more directly compare properties or tags with different value ranges over the same time period.
to view details of the selected trend. View selected tags or properties on the trend over varying lengths of time by choosing one of the preset timeframes, or by defining a custom timeframe. On the graph, click and drag vertically or horizontally to zoom in and double-click to zoom out. The selection for each property or tag under the left-or-right axis icon (
To create a trend:
1. At the top of the Trending and Troubleshooting page, click  .
.
.2. In the New Trend window, enter a name and optional description. Click OK.
3. On the details page of the trend, click  .
.
.4. On the ADD TAGS OR PROPERTIES TO TREND window, select the equipment type and piece of equipment.
5. Select up to five properties or tags to trend for the selected equipment.
Trends defined for properties which are bound to KEPServerEX tags have better performance than trends defined directly on the KEPServerEX tags themselves. |