Production KPIs

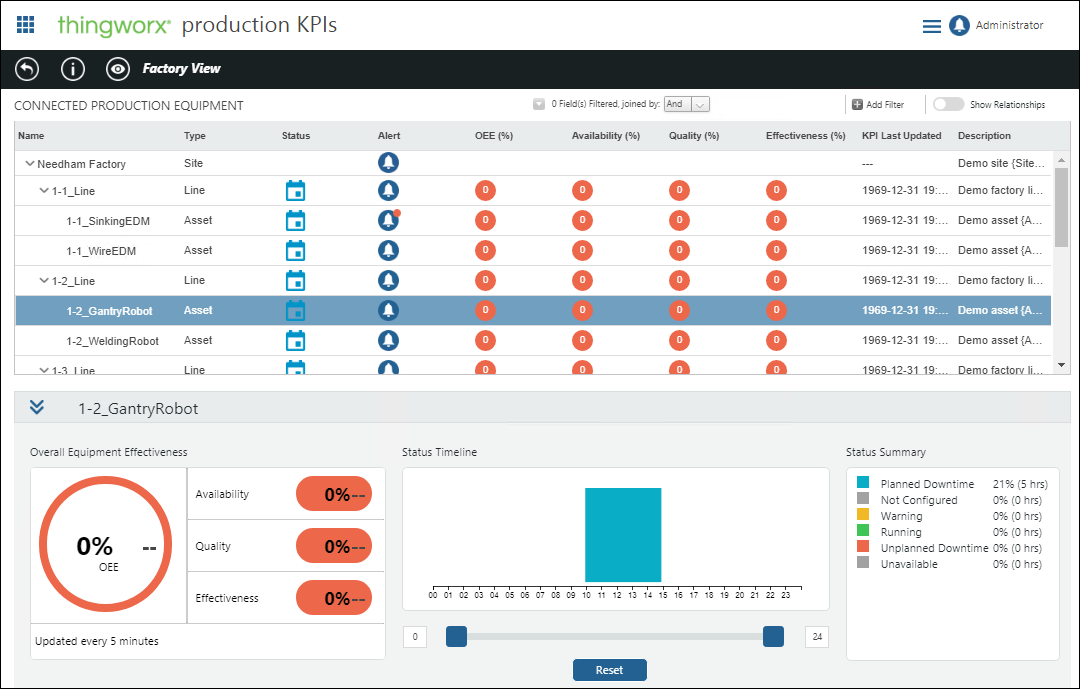
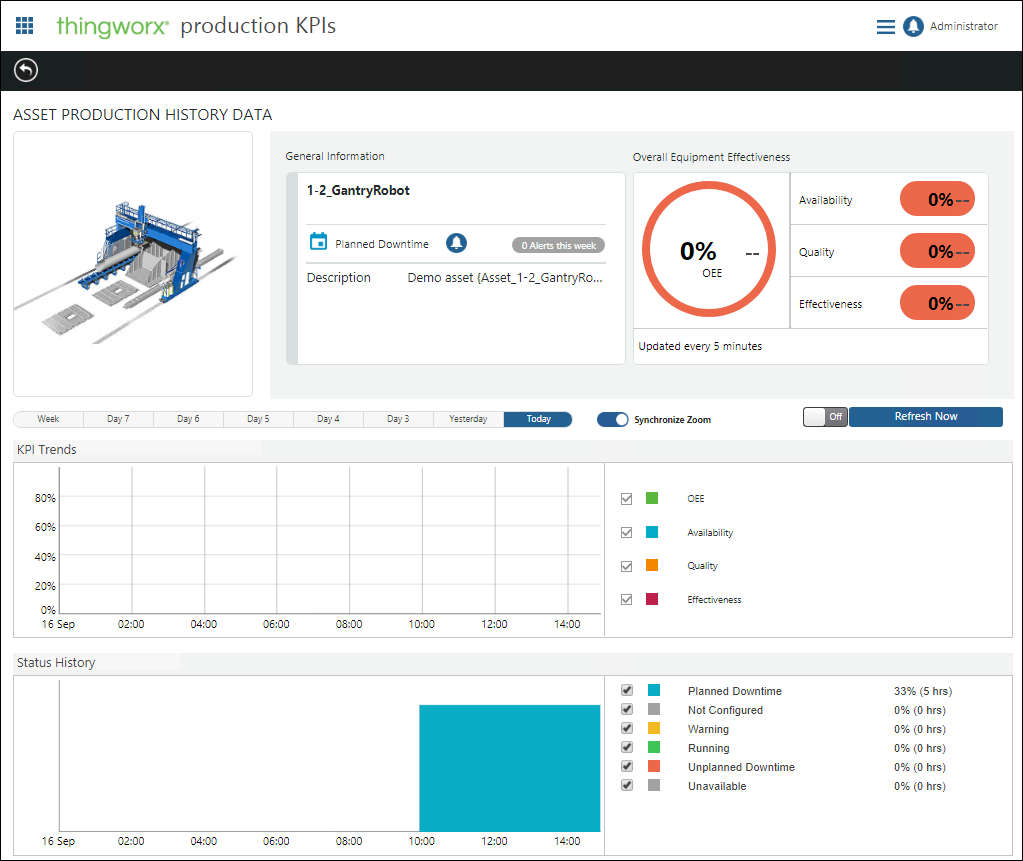
From Production KPIs, Production Managers can monitor production line utilization and performance, viewing real-time operational performance data that is unified from disparate sources. This enables fast-informed decisions with contextual information, as well as the ability to drill down for root cause analysis. All equipment for which the current user has read (Read) permission in the currently selected context is displayed. Sample pages are shown in the following figures.

Production KPIs Features
Use the filter options at the top of the page to create filters for the lines and assets that display.
• Add multiple filters.
• Determine the logical operator between created filters.
• Display related lines or assets with the Show Relationships option.
Click the view production history data icon  for detailed information on the equipment, such as performance and status history.

• On the KPI Trends and Status History graphs, click and drag vertically or horizontally to zoom in and double-click to zoom out. Synchronize Zoom means when you zoom in on one graph, the other graph zooms to the same time frame.
• Navigate back in time using preset time ranges to display up to a week of data.
• Refresh data on the graphs manually or automatically using the Refresh Now option.