Interpreting Prescriptive Scoring Results
The results from a prescriptive scoring job can be output in a CSV format. Each row in the results output represents a specific results record. The specific columns in the output vary according to the parameters you configure when you launch the scoring job. The following types of columns can be included in prescriptive scoring results:
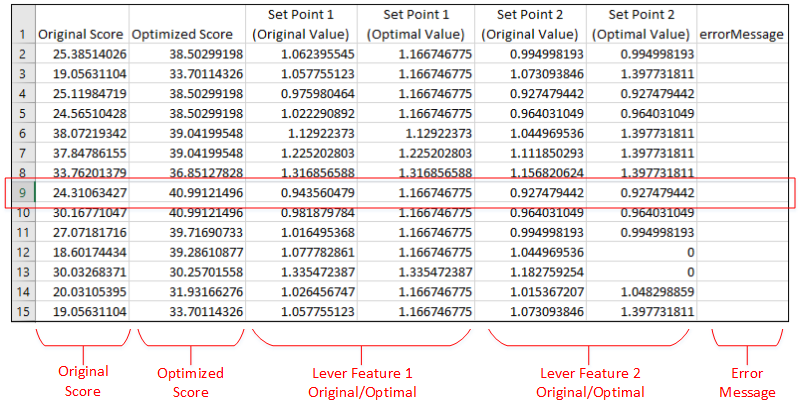
• Original Score – The original predictive value assigned to a given record by the prediction model, before any changes are made to the lever features.
• Optimized Score – The score assigned to the same record after alterations to the lever features have been completed.
• Lever Feature (Original Value) – For each lever feature you included in the prescriptive scoring request, the original value from the data is listed.
• Lever Feature (Optimal Value) – For each lever you included in the scoring request, an optimal value is listed for maximizing or minimizing the goal. The prescriptive scoring procedure iteratively alters the values for each lever to evaluate its effect on the goal. This column represents the best value for a specific lever to produce the desired effect on the goal or other outcome.
• Error Message – This column displays any errors that occur while trying to score a specific record.
The sample results below were output, in a CSV format, from an asynchronous prescriptive scoring job. The goal in this theoretical example is to maximize the output of the next batch of a process. A number of variables influence the quality and amount of product produced during the process, including pressure, flow rates, and temperatures. Only two set points are available for operators to control.To provide the operators with recommended values for these two set points, the prescriptive scoring job identifies which optimal values, based on all the other conditions, will maximize the output.The two set points are identified as lever fields.
In the figure below, the results have been opened in an Excel spreadsheet. Each row represents a specific production batch.For each batch, the results show the predicted and optimized score along with the original and optimal settings for the two set points. For example, in row 9, based on all known operating conditions and variables, output can be increased by adjusting the value of Set Point 1 up to 1.1667 and keeping Set Point 2 at the same level.
