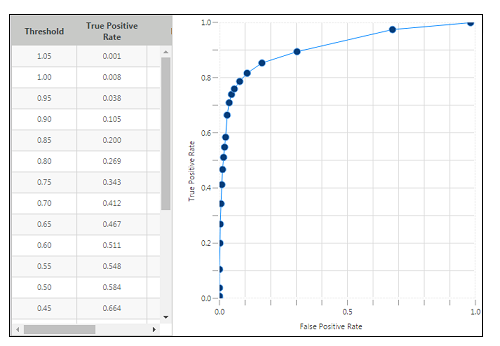
ROC Curve Results
A ROC curve plots the true positive rates against false positive rates at various discrimination thresholds. For a good model, the curve will rise quickly on the left and stay close to the top, showing that the model predictions were accurate. Displayed only when the goal variable is a Boolean.

When a Boolean goal value is selected during model creation, the Results Graph offers the option to view either a ROC Curve or a Confusion Matrix. Both graphs are available on separate tabs that you can toggle between. |