To Add or Delete a Second Y-Axis
Insert a Chart component, define the X and Y expressions, plot the trace, and then double-click the plot area to open the PTC Mathcad Chart application.
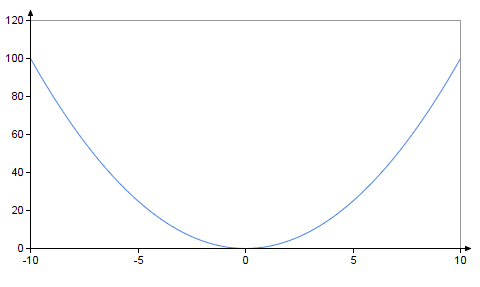
The chart below appears in the graphics area:
To add a second y-axis:
1. Click the Axes tab.
2. In the Secondary Y-axis group, click the Add 2nd Y-axis button. The plot is updated accordingly:
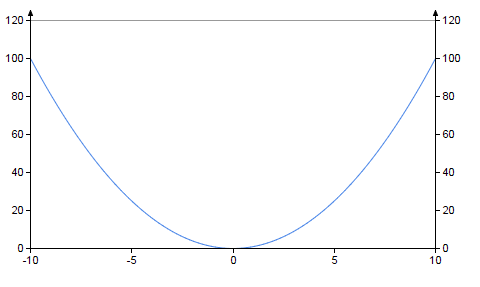
The second y-axis is added to the right side of the plot, using the same minimum and maximum tick mark values as the y-axis. The second y-axis icon  is added to the application sidebar.
is added to the application sidebar.3. To delete the second y-axis, in the Secondary Y-axis group, click the Delete 2nd Y-axis button. The plot is updated accordingly.