Example: Z Score of a Vector of Data
Compute a z-score for a vector of normally distributed data with known population standard deviation.
1. Define a data set to be analyzed.

2. Calculate the sample mean m_s.


3. Define the significance level, the population standard deviation, and the proposed population mean.


4. Calculate the z-score.


5. State the null and the alternative hypothesis for a two-tailed test.
H0: m = μ
H1: m ≠ μ
6. Use the pnorm function to calculate the p-value and test the hypothesis. In this example, all of the Boolean expressions evaluate to 1 when the null hypothesis is true (you do not reject H0).


There is a 4.11*10-10 probability that the test statistic is greater than the one observed, assuming that the null hypothesis is true. The comparison between the p-value and the significance level indicates there is evidence that the alternative hypothesis is true.
7. Use the qnorm function to calculate the limits of the critical region and test the hypothesis.


Reject the null hypothesis. There is evidence that the mean is not equal to μ.
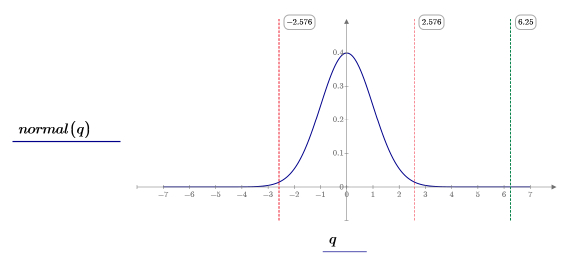
8. Use the dnorm function to calculate and plot the standard normal distribution (blue), the boundaries of the critical region (red) , and the z-score (green).