Custom Color Setting
You can change the color of math, text, and plots in the following tabs:
• Text Formatting tab, in the Text Font group.
• Math Formatting tab, in the Math Font and Label Styles group.
• Plots tab, in the Styles group. You can customize the colors of traces and 3D surface fills.
To change the color, click the drop-down button next to the relevant color selection icon and choose one of the predefined colors.
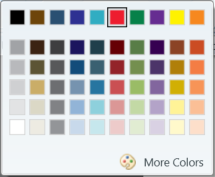
To use a custom color, click More Colors.
Click within the Colors box to select a color. Drag the vertical slider to set the luminosity.
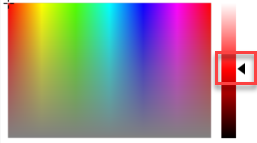
• To set RGB or HSL, drag the slider in each category or type specific values.
• To set a specific hexadecimal color code, type the code in the New field.