Example 10: GraphMat
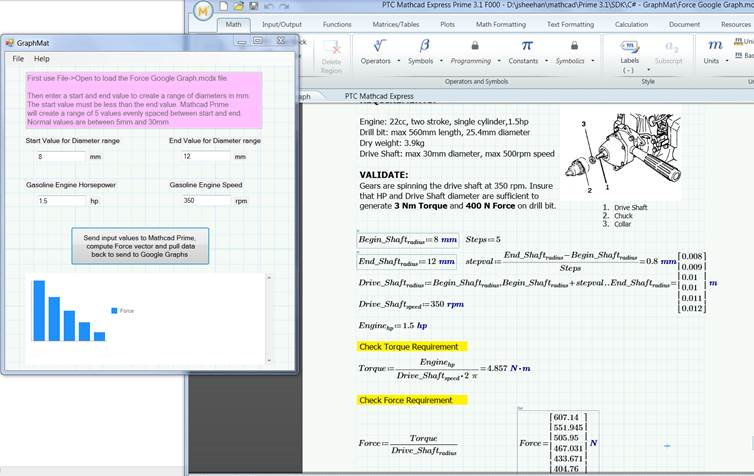
This example demonstrates in C# how to launch PTC Mathcad Prime, load a worksheet, push scalar values to the worksheet, compute the worksheet, and pull back a matrix result. It uses .NET APIs, PTC Mathcad PrimeAPIs, and Google Charts APIs to create a solution.
1. Download the example here: C#_GraphMat.
2. To run the example, execute GraphMatrix.exe. The GraphMat dialog window opens. All input fields are disabled.
3. Click > to open the Force Google Graph.mcdx worksheet. When this worksheet opens, the GraphMat input fields become enabled.

4. In the open worksheet, note the four input regions at the top of the second page, and the two output regions at the bottom of the third page.
5. In the GraphMat dialog window, you can modify any of the four text boxes before clicking Send input values to send the values to the worksheet.
6. In the worksheet, the four input regions now reflect the values you set in the GraphMat dialog window. PTC Mathcad Prime recalculates the worksheet and sends the values of SForce and outstring to the GraphMat dialog window as a chart and a string of numbers displayed below the graph. To meet Google Charts limitations, the Force vector is scaled to generate SForce to ensure that the range of its elements is 0-100.
7. For the next calculation, set new diameter or engine values, then click Send input values. The graph and the string of numbers are updated accordingly.
8. In PTC Mathcad Prime, click > , and then in GraphMat dialog window click > .
1. All matrix code is in the Button1 callback. 2. Launching PTC Mathcad Prime and loading a worksheet are common to many other examples, including Send SExpression. 3. This example was generated using VS2019 and .NET 4.8. |