Example: Converting Units in Plots
Change the units in an axis expression.
1. Define a range variable and a function with units.


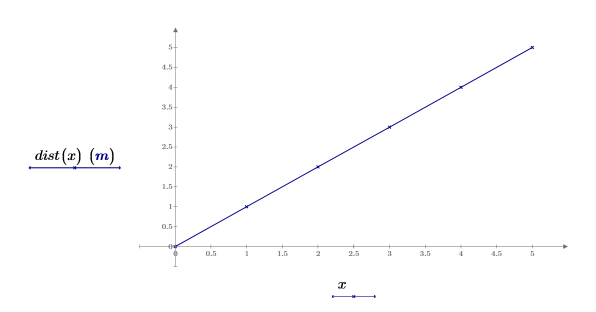
2. Plot the function.

The tick mark values are displayed in terms of the base units of the unit system that you are using, regardless of the units entered. |
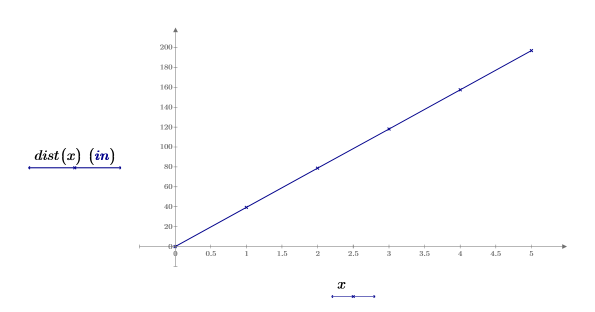
3. Change the units in which the y-axis expression is plotted by deleting the meter abbreviation m from the unit placeholder and inserting the inch abbreviation in in the empty placeholder.

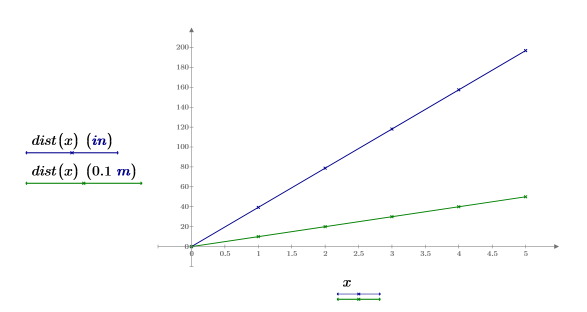
4. Replot the same function but this time add a scaling factor in the unit placeholder instead of converting the units.

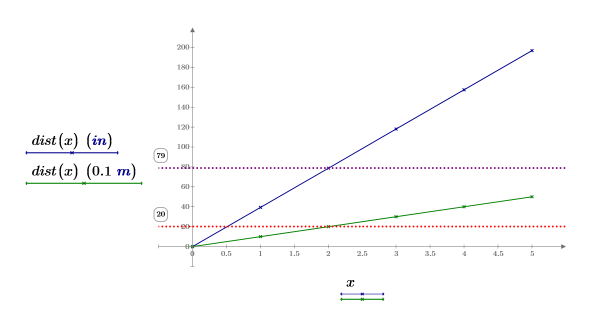
The traces represent equivalent numbers. For example, the second point on the first trace is at 79 in = 2 meters. On the second trace, it is as 20 * 0.1 m = 2 meters.
5. Insert two horizontal markers to mark the above two data points.

Tick marks and the callout values are unitless. Only axis expressions can have units. |