To Add and Format a Legend
1. Click the
Chart icon

, and then click the
Legend tab.
2. Select the Chart Legend checkbox. A legend appears automatically in the chart, populated with the default trace color, number, and location.
3. Specify the Location, Font, Color, Styles, Size, and Columns.
4. Select the Border checkbox and specify the Color, Style, Thickness, and Corners.
5. Select the Background checkbox and specify the Fill and Opacity.
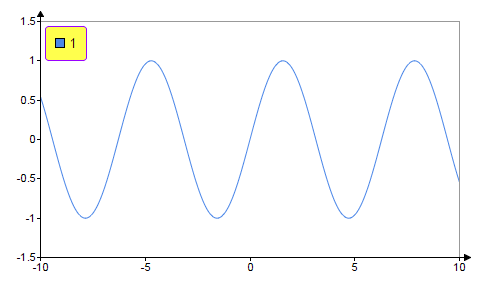
For example, in the chart below:
• Legend location is Top, Left
• Border color is purple, and its corners are set to 3px
• Background color is yellow and its opacity is set to 70 %